

Question: Presented below in the table are the average household weekly expenditure ($) of the selected major commodity groups by household income quintile in Australia in
Presented below in the table are the average household weekly expenditure ($) of the selected major commodity groups by household income quintile in Australia in 2015-16. Using the information provided, choose any three commodity groups to analyze the patterns of consumption of these commodity groups by households with different levels of income. You are expected to apply appropriate concepts and calculate appropriate indicators in your analysis.
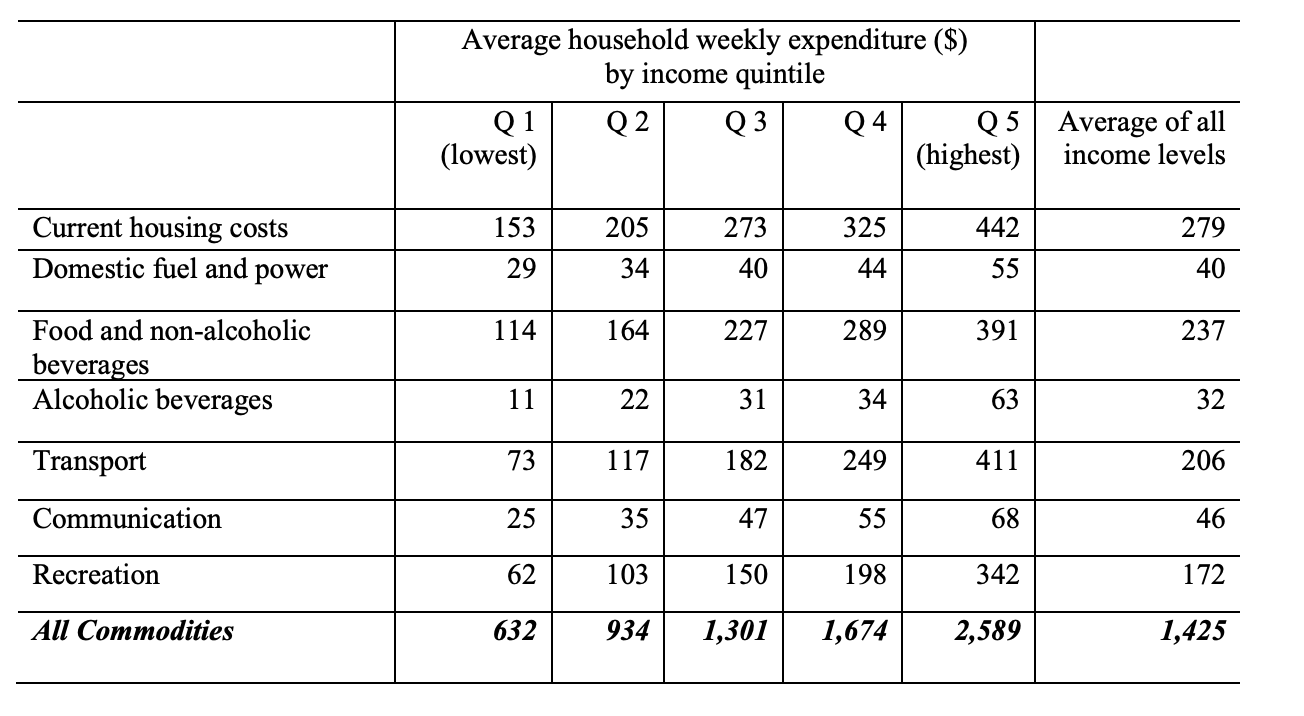
Average household weekly expenditure ($) by income quintile Q 1 Q2 Q3 Q 4 Q5 Average of all (lowest) (highest) income levels Current housing costs 153 205 273 325 442 279 Domestic fuel and power 29 34 40 44 55 40 Food and non-alcoholic 114 164 227 289 391 237 beverages Alcoholic beverages 11 22 31 34 63 32 Transport 73 117 182 249 411 206 Communication 25 35 47 55 68 46 Recreation 62 103 150 198 342 172 All Commodities 632 934 1,301 1,674 2,589 1,425
Step by Step Solution
There are 3 Steps involved in it

Get step-by-step solutions from verified subject matter experts