

Question: Presented below is financial data for the Lite Company as of year-end 2018 and 2019 2018 2019 Current Assets $90,000 $112.000 Total Assets 250.000 150.000
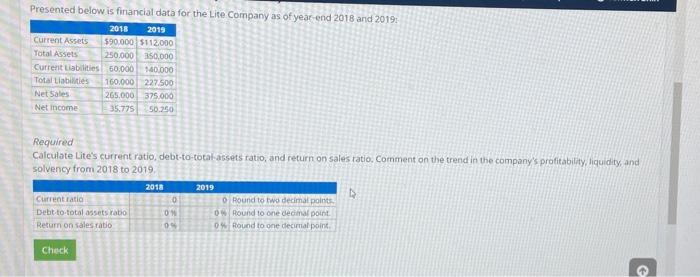
Presented below is financial data for the Lite Company as of year-end 2018 and 2019 2018 2019 Current Assets $90,000 $112.000 Total Assets 250.000 150.000 Current Liabilities 50,000 140.000 Total Liabilities 160.000 227.500 Net Sales 265.000 375.000 Net income 35.775 50.250 Required Calculate Lite's current ratio, debt-to-total assets ratio, and return on sales ratio. Comment on the trend in the company's profitability, liquidity, and solvency from 2018 to 2019, 2018 2019 Current ratio O Round to two decimal points Debt-to-total assets ratio 0 0 Round to one decimal point Return on sales ratio 09 0% found to one decimal point Check
Step by Step Solution
There are 3 Steps involved in it
1 Expert Approved Answer
Step: 1 Unlock

Question Has Been Solved by an Expert!
Get step-by-step solutions from verified subject matter experts
Step: 2 Unlock
Step: 3 Unlock