

Question: Presented below is the 2018 income statement and comparative balance sheet information for Tiger Enterprises. $15,000 5 9,700 5,300 2,120 $ 3,180 Dec. 31, 2017
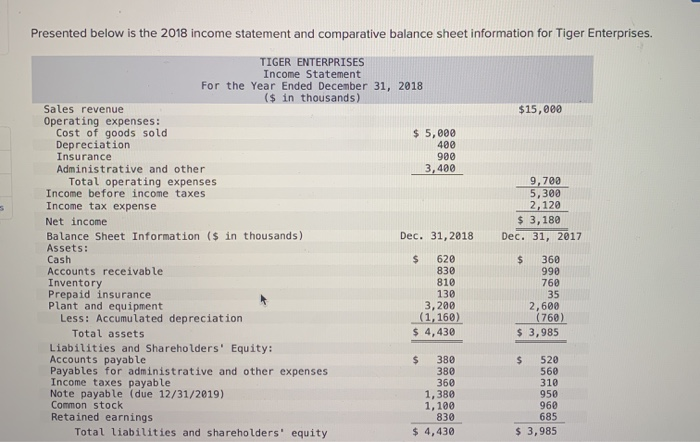
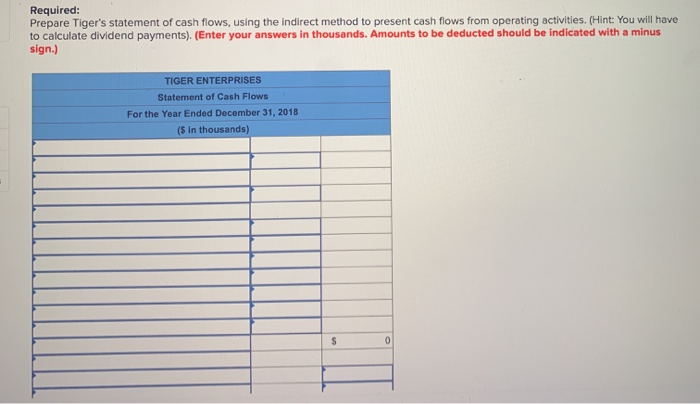
Presented below is the 2018 income statement and comparative balance sheet information for Tiger Enterprises. $15,000 5 9,700 5,300 2,120 $ 3,180 Dec. 31, 2017 TIGER ENTERPRISES Income Statement For the Year Ended December 31, 2018 ($ in thousands) Sales revenue Operating expenses: Cost of goods sold $ 5,000 Depreciation 400 Insurance 900 Administrative and other 3,400 Total operating expenses Income before income taxes Income tax expense Net income Balance Sheet Information ($ in thousands) Dec. 31, 2018 Assets: Cash $ 620 Accounts receivable 830 Inventory 810 Prepaid insurance 130 Plant and equipment 3,200 Less: Accumulated depreciation (1,160) Total assets $ 4,430 Liabilities and Shareholders' Equity: Accounts payable $ 380 Payables for administrative and other expenses 380 Income taxes payable 360 Note payable (due 12/31/2019) 1,380 Common stock 1,100 Retained earnings 830 Total liabilities and shareholders' equity $ 4,430 $ 360 990 760 35 2,600 (760) $ 3,985 $ 520 560 310 950 960 685 $ 3,985 Required: Prepare Tiger's statement of cash flows, using the indirect method to present cash flows from operating activities. (Hint: You will have to calculate dividend payments). (Enter your answers in thousands. Amounts to be deducted should be indicated with a minus sign.) TIGER ENTERPRISES Statement of Cash Flows For the Year Ended December 31, 2018 ($ in thousands) $ 0 ($ in thousands) Net income Net loss 0 0 0 ($ in thousands) VELICUS FUCCUOL payou Decrease in accounts receivable Decrease in administrative and other payables Depreciation expense Increase in income taxes payable Increase in inventory 0 0
Step by Step Solution
There are 3 Steps involved in it

Get step-by-step solutions from verified subject matter experts