

Question: Presented below is the comparative balance sheet for Riverbed Company. RIVERBED COMPANY COMPARATIVE BALANCE SHEET AS OF DECEMBER 31, 2018 AND 2017 December 31 2018
Presented below is the comparative balance sheet for Riverbed Company.
| RIVERBED COMPANY COMPARATIVE BALANCE SHEET AS OF DECEMBER 31, 2018 AND 2017 | ||||||
| December 31 | ||||||
| 2018 | 2017 | |||||
| Assets | ||||||
| Cash | $181,000 | $274,900 | ||||
| Accounts receivable (net) | 218,200 | 155,000 | ||||
| Short-term investments | 271,900 | 151,100 | ||||
| Inventories | 1,068,900 | 987,000 | ||||
| Prepaid expenses | 25,300 | 25,300 | ||||
| Plant & equipment | 2,582,500 | 1,938,300 | ||||
| Accumulated depreciation | (1,003,400) | (743,300) | ||||
| $3,344,400 | $2,788,300 | |||||
| Liabilities and Stockholders Equity | ||||||
| Accounts payable | $50,100 | $74,800 | ||||
| Accrued expenses | 171,400 | 199,400 | ||||
| Bonds payable | 453,100 | 191,600 | ||||
| Capital stock | 2,113,200 | 1,787,100 | ||||
| Retained earnings | 556,600 | 535,400 | ||||
| $3,344,400 | $2,788,300 | |||||
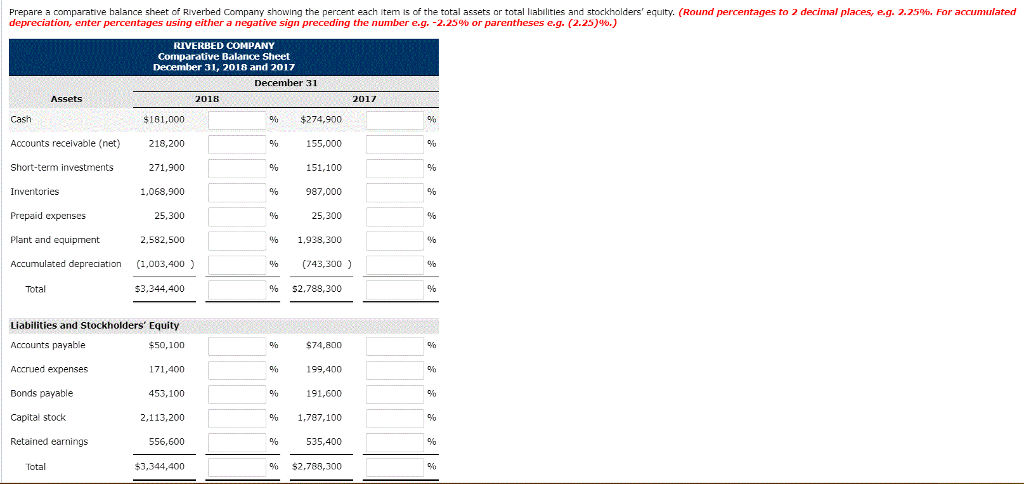
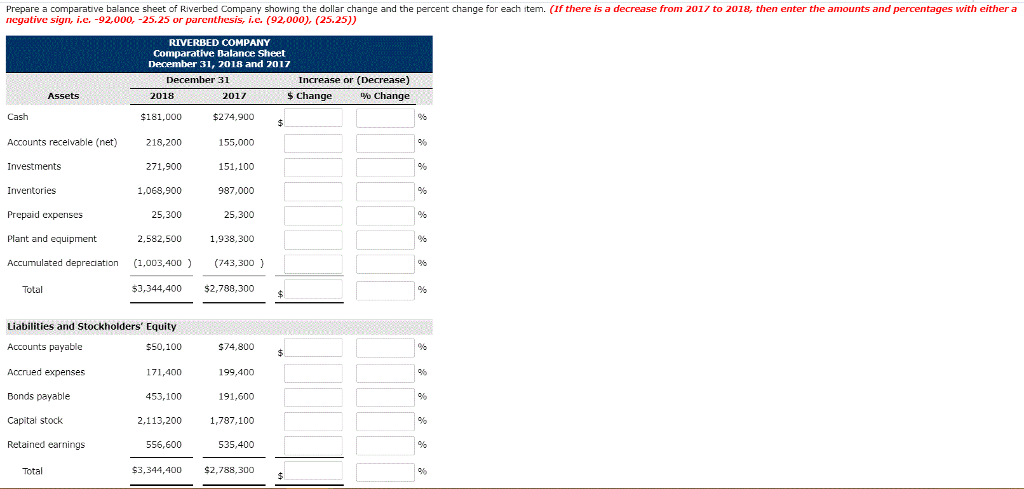
Prepare a comparative balance sheet of Riverbed Company showing the percent each item is of the total assets or total liabilities and stockholders equity. (Round percentages to 2 decimal places, e.g. 2.25%. For accumulated depreciation, enter percentages using either a negative sign preceding the number e.g.-2.25gb or parentheses e.g. (2.25)%.) RIVERBED COMPANY Comparative Balance Sheet December 31, 2018 and 2017 December 31 2018 2017 $181,000 Accounts receivable (net)218,200 271,900 1,068,900 25,300 2,582,500 % $274,900 155,000 151,100 987,000 25,300 % 1,938,300 Cash Short-tem investments Prepaid expenses Plant and equipment Accumulated depreciation (1,003,400) % (743.300 ) Total $3,344,400 % $2,788,300 Liabilities and Stockholders' Equity Accounts payable Accrued expenses Bonds payable Capital stock Retained earnings $50,100 171,400 453,100 2,113,200 5S6,600 3,344,400 % $74,800 199,400 % 191,600 % 1,787,100 % 535,400 % $2,788,300 9V% Total Prepare a comparative balance sheet of Riverbed Company showing the dollar change and the percent change for each item. (If there is a decrease from 2017 to 2018, then enter the amounts and percentages with either a negative sign, i.e. -92,000, -25.25 or parenthesis, i.e. (92,000), (25.25)) RIVERBED COMPANY Comparative Balance Sheet December 31, 2018 and 2017 December 31 Increase or (Decrease) oyo Change 2018 2017 s Change Cash $181,000 Accounts receivable (net218,200 271,900 1,068,900 25,300 2.582,500 $274,900 155,000 151,100 987,000 25,300 1,938,300 Accumulated depreiation(1,003,400 (743,300 53,344,400$2,788,300 Investments Prepaid expenses Plant and equipment Total Liabilities and Stockholders' Equity Accounts payable Accrued expenses Bonds payable Capital stock Retained earnings $50,100 171,400 453,100 2,113,200 556,600 $74,800 199,400 191,600 1,787,100 535,400 $3,344,400 $2,788,300 9% Total
Step by Step Solution
There are 3 Steps involved in it

Get step-by-step solutions from verified subject matter experts