

Question: Presented here are summarized data from the balance sheets and income statements of Wiper, Inc. WIPER, INC Condensed Balance Sheets December 31, 2017, 2016, 2015
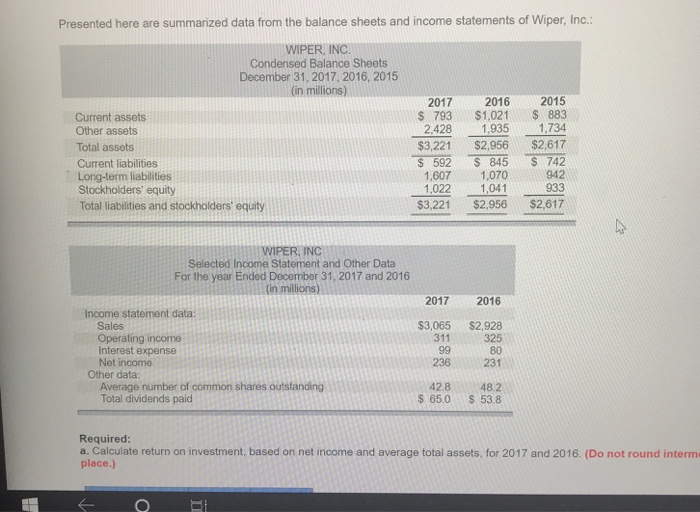
Presented here are summarized data from the balance sheets and income statements of Wiper, Inc. WIPER, INC Condensed Balance Sheets December 31, 2017, 2016, 2015 (in millions) Current assets Other assets Total assets Current liabilities Long-term liablities Stockholders' equity Total liabilities and stockholders equity 2017 2016 2015 s 793 $1,021 883 2,428 1,935 1,734 $3,221$2,956 $2,617 592 S 845 S 742 1,607 1,070942 1,041 $3,221$2,956 $2,617 1,022 933 INC Selected Income Statement and Other Data For the year Ended December 31, 2017 and 2016 (in millions) 2017 2016 Income statement data Sales Operating income Interest expense Net income $3,065 $2,928 311 325 80 231 236 Other data Average number of common shares outstanding Total dividends paid 42848.2 $ 65.0 $ 53.8 Required a. Calculate return on investment, based on net income and average total assets, for 2017 and 2016. (Do not round interma place.)
Step by Step Solution
There are 3 Steps involved in it

Get step-by-step solutions from verified subject matter experts