

Question: Presented in the bar charts are three columns for each of the first three years of a company's operations. The three columns represent amounts reported
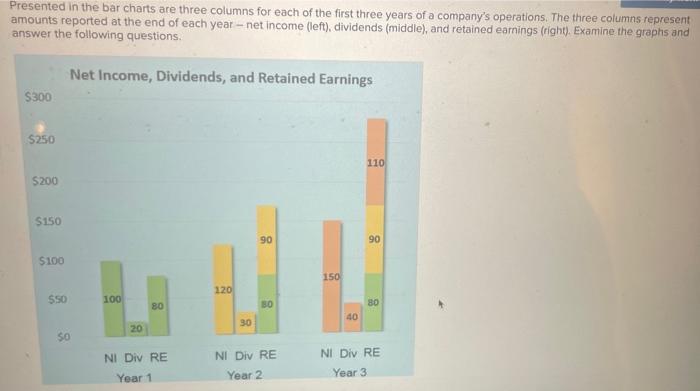
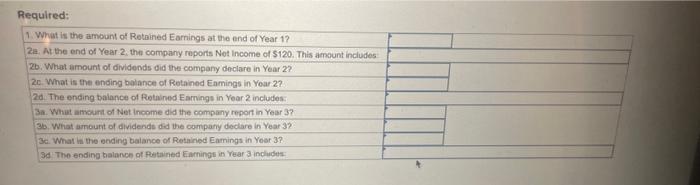
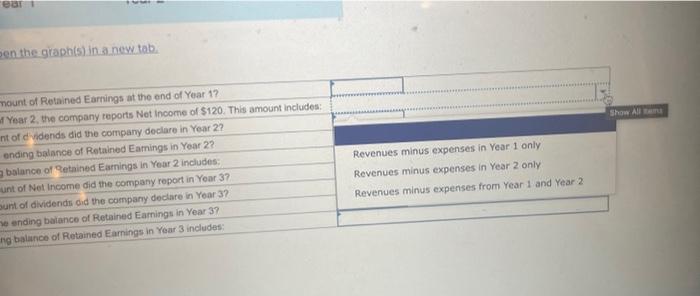
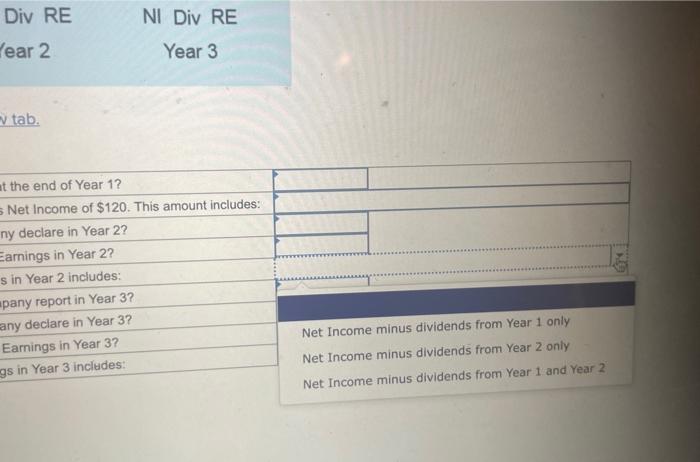

Presented in the bar charts are three columns for each of the first three years of a company's operations. The three columns represent amounts reported at the end of each year - net income (left), dividends (middle), and retained earnings (right). Examine the graphs and answer the following questions. Required: ien the graph(s) in. a now tab. Div RE NI Div RE ear 2 Year 3 tab. the end of Year 1? Net Income of $120. This amount includes: ny declare in Year 2? Earnings in Year 2? s in Year 2 includes: pany report in Year 3? any declare in Year 3? Net Income minus dividends from Year 1 only Earnings in Year 3? Net Income minus dividends from Year 2 only Net Income minus dividends from Year 1 and Year 2 Year 3 tab. the end of Year 1 ? Net Income of $120. This amount includes: declare in Year 2? Net Income minus dividends from Year 1 only mings in Year 2? Net Income minus dividends from Year 2 only Net Income minus dividends from Year 3 only Net Income minus dividends from Year 1, Year 2, and Year 3
Step by Step Solution
There are 3 Steps involved in it

Get step-by-step solutions from verified subject matter experts