

Question: Presented in the bar charts are three columns for each of the first three years of a company's operations. The three columns represent amounts reported
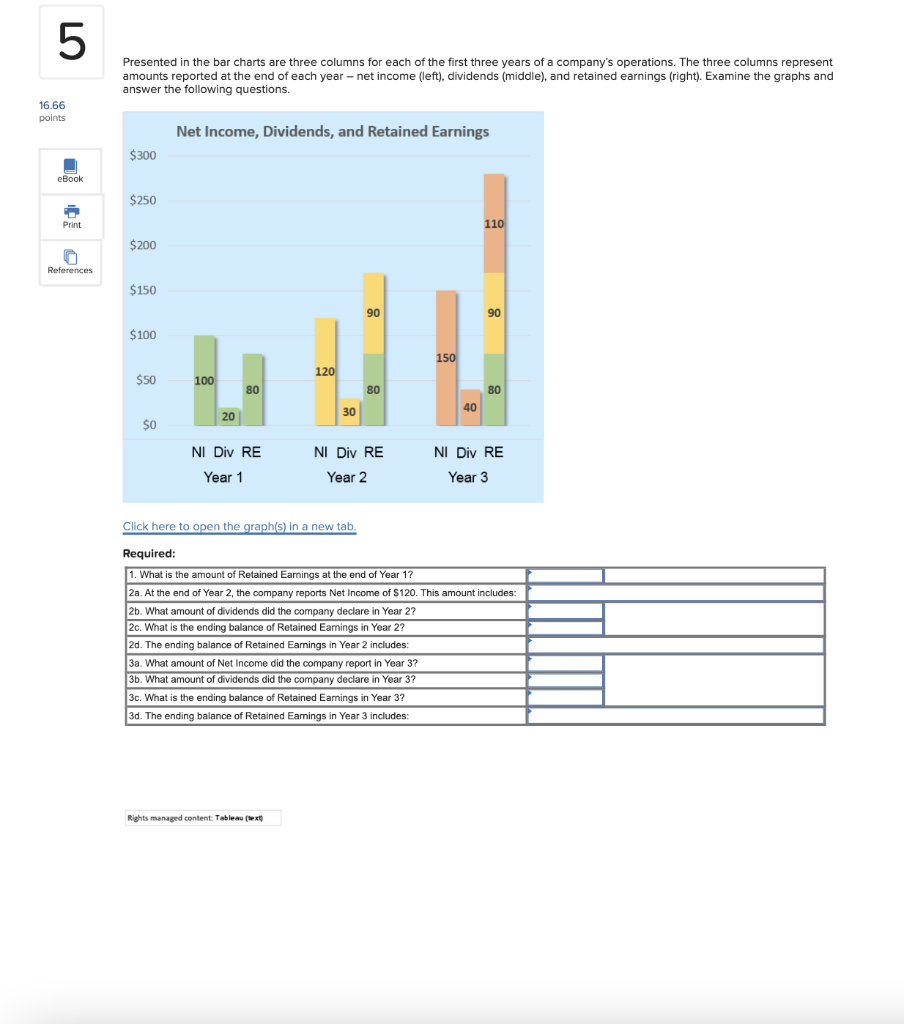
Presented in the bar charts are three columns for each of the first three years of a company's operations. The three columns represent amounts reported at the end of each year - net income (left), dividends (middle), and retained earnings (right). Examine the graphs and answer the following questions. Click here to open the graph(s) in a new tab
Step by Step Solution
There are 3 Steps involved in it
1 Expert Approved Answer
Step: 1 Unlock

Question Has Been Solved by an Expert!
Get step-by-step solutions from verified subject matter experts
Step: 2 Unlock
Step: 3 Unlock