

Question: Preview Layout Views A1 fx Capital spending D B C E F H G 547,000 300,000 35,000 8,800 109,400 40% 20% 4 1 2014 2
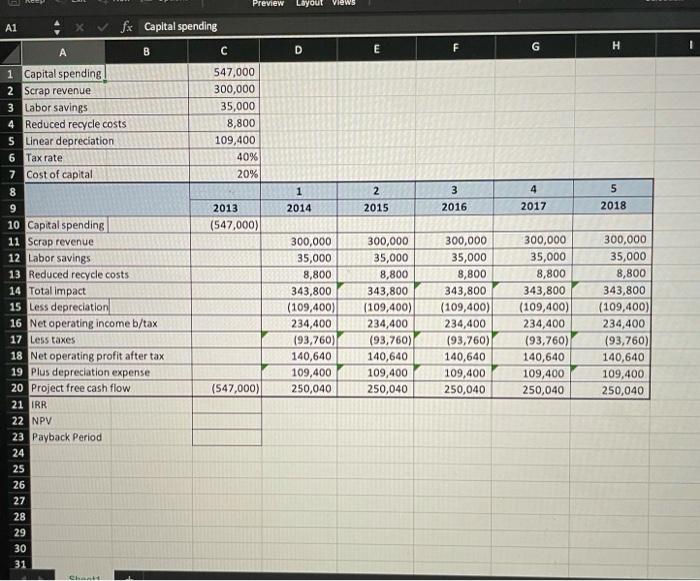
Preview Layout Views A1 fx Capital spending D B C E F H G 547,000 300,000 35,000 8,800 109,400 40% 20% 4 1 2014 2 2015 3 2016 5 2018 2017 2013 (547,000) 1 Capital spending 2 Scrap revenue 3 Labor savings 4 Reduced recycle costs 5 Linear depreciation 6 Tax rate 7 Cost of capital 8 9 10 Capital spending 11 Scrap revenue 12 Labor savings 13 Reduced recycle costs 14 Total impact 15 Less depreciation 16 Net operating income b/tax 17 Less taxes 18 Net operating profit after tax 19 Plus depreciation expense 20 Project free cash flow 21 IRR 22 NPV 23 Payback Perio 24 25 26 27 28 29 30 31 300,000 300,000 35,000 35,000 8,800 8,800 343,800 343,800 (109,400) (109,400) 234,400234,400 (93,760) (93,760) 140,640 140,640 109,400 109,400 250,040 250,040 300,000 35,000 8,800 343,800 (109,400) 234,400 (93,760) 140,640 109,400 250,040 300,000 35,000 8,800 343,800 (109,400) 234,400 (93,760) 140,640 109,400 250,040 300,000 35,000 8,800 343,800 (109,400) 234,400 (93,760) 140,640 109,400 250,040 (547,000) Ch
Step by Step Solution
There are 3 Steps involved in it

Get step-by-step solutions from verified subject matter experts