

Question: price controls 1. The data in the table below refers to the compact disc market. 1. The data in the table below refers to the
price controls 1. The data in the table below refers to the compact disc market.
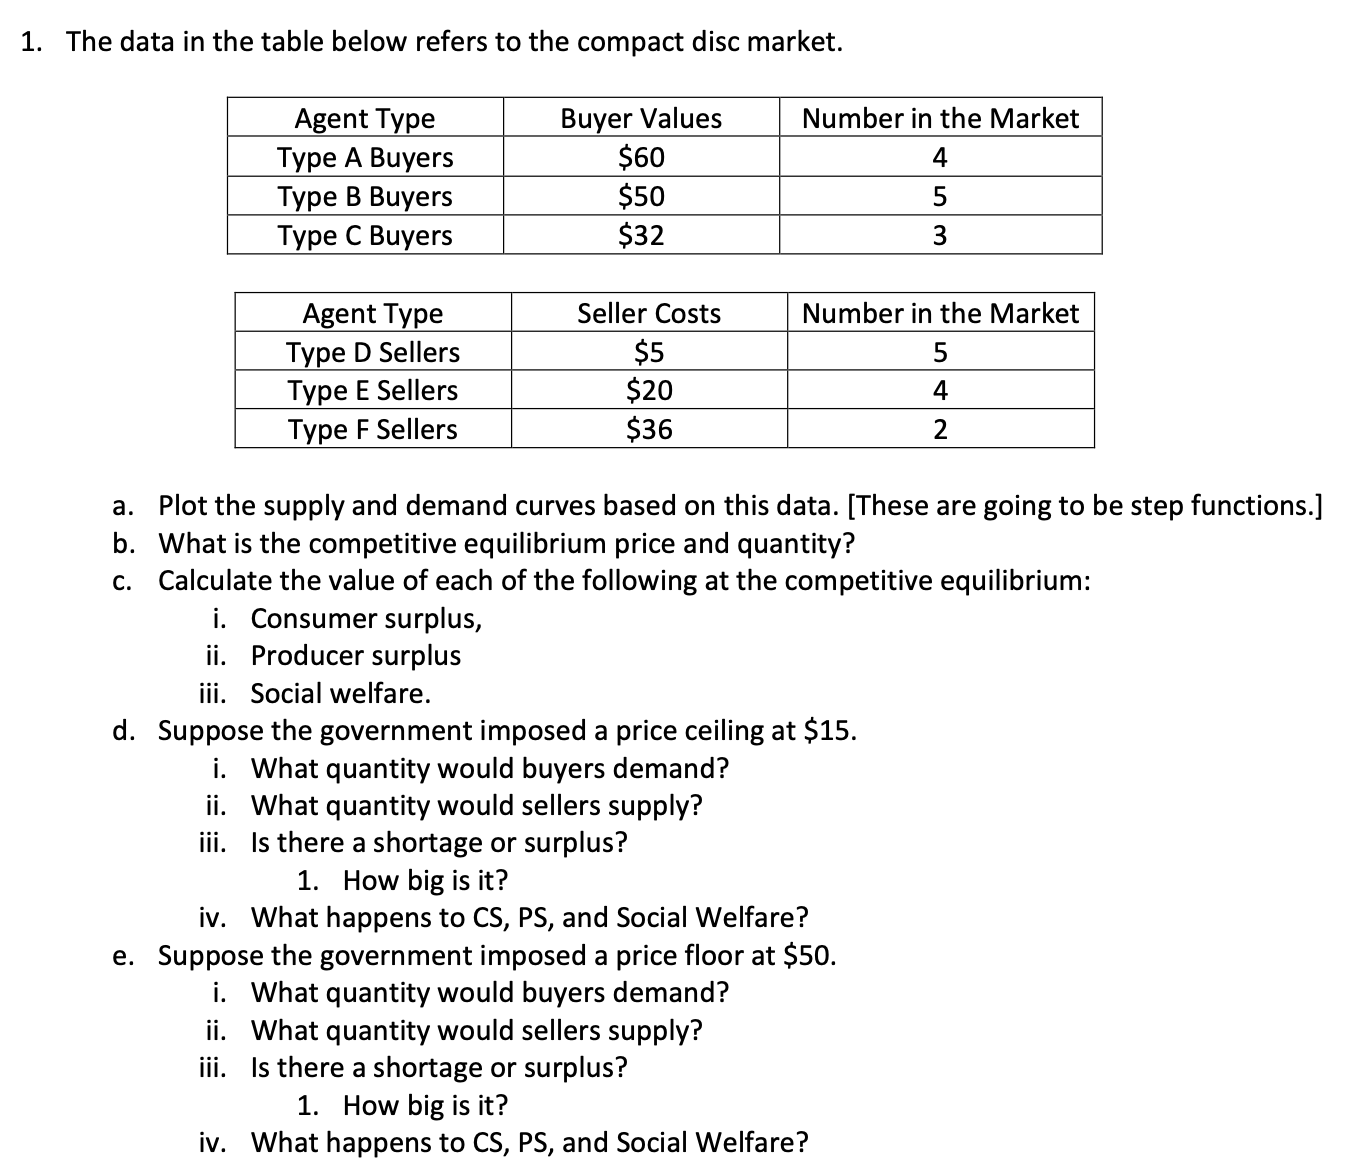
1. The data in the table below refers to the compact disc market. Agent Type Buyer Values Number in the Market Type A Buyers $60 4 Type B Buyers $50 5 Type c Buyers I Agent Type Seller Costs Number in the Market Type D Sellers $5 Type E Sellers $20 4 Type F Sellers $36 2 a. Plot the supply and demand curves based on this data. [These are going to be step functions] b. What is the competitive equilibrium price and quantity? c. Calculate the value of each of the following at the competitive equilibrium: i. Consumer surplus, ii. Producer surplus iii. Social welfare. d. Suppose the government imposed a price ceiling at $15. i. What quantity would buyers demand? ii. What quantity would sellers supply? iii. Is there a shortage or surplus? 1. How big is it? iv. What happens to CS, PS, and Social Welfare? e. Suppose the government imposed a price floor at 550. i. What quantity would buyers demand? ii. What quantity would sellers supply? iii. Is there a shortage or surplus? 1. How big is it? iv. What happens to CS, PS, and Social Welfare
Step by Step Solution
There are 3 Steps involved in it

Get step-by-step solutions from verified subject matter experts