

Question: Price (Dollars per piece) Sean's Quantity Supplied Yvette's Quantity Supplied (Pieces) (Pieces) 15 30 1 2 0 15 3 25 40 4 30 50
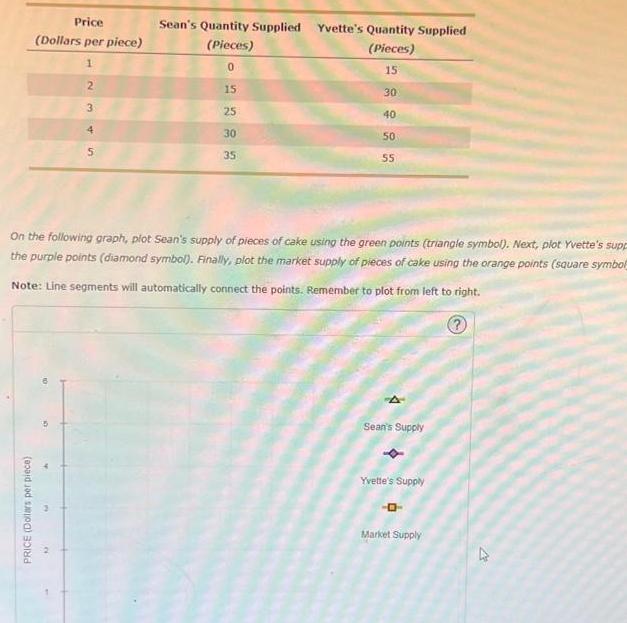
Price (Dollars per piece) Sean's Quantity Supplied Yvette's Quantity Supplied (Pieces) (Pieces) 15 30 1 2 0 15 3 25 40 4 30 50 5 35 55 On the following graph, plot Sean's supply of pieces of cake using the green points (triangle symbol). Next, plot Yvette's supp the purple points (diamond symbol). Finally, plot the market supply of pieces of cake using the orange points (square symbol Note: Line segments will automatically connect the points. Remember to plot from left to right. PRICE (Dollars per piece) Sean's Supply Yvette's Supply -0- Market Supply ^
Step by Step Solution
There are 3 Steps involved in it
1 Expert Approved Answer
Step: 1 Unlock

Question Has Been Solved by an Expert!
Get step-by-step solutions from verified subject matter experts
Step: 2 Unlock
Step: 3 Unlock