

Question: Price Q.Q Quantity demanded per period Q2 Quantity demanded per period GRAPH 1 GRAPH 2 Review the two graphs above. Fill in the first three
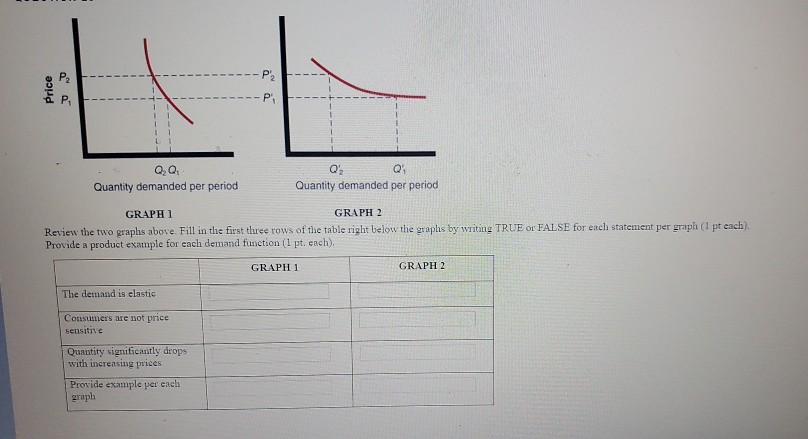
Price Q.Q Quantity demanded per period Q2 Quantity demanded per period GRAPH 1 GRAPH 2 Review the two graphs above. Fill in the first three rows of the table right below the graphs by writing TRUE O FALSE for ench statement per graph (1 pt each) Provide a product example for each demand function (1 pt. each). GRAPH 1 GRAPH 2 The demand is elastic Consumers are not price sensitie Quantity significantly drops with increasing prices Provide example per each graph
Step by Step Solution
There are 3 Steps involved in it
1 Expert Approved Answer
Step: 1 Unlock

Question Has Been Solved by an Expert!
Get step-by-step solutions from verified subject matter experts
Step: 2 Unlock
Step: 3 Unlock