

Question: Price ($) S 7 D B E 4 F G 2 H D 30 60 75 Quantity Figure 1. Junk food market (Standard serves per
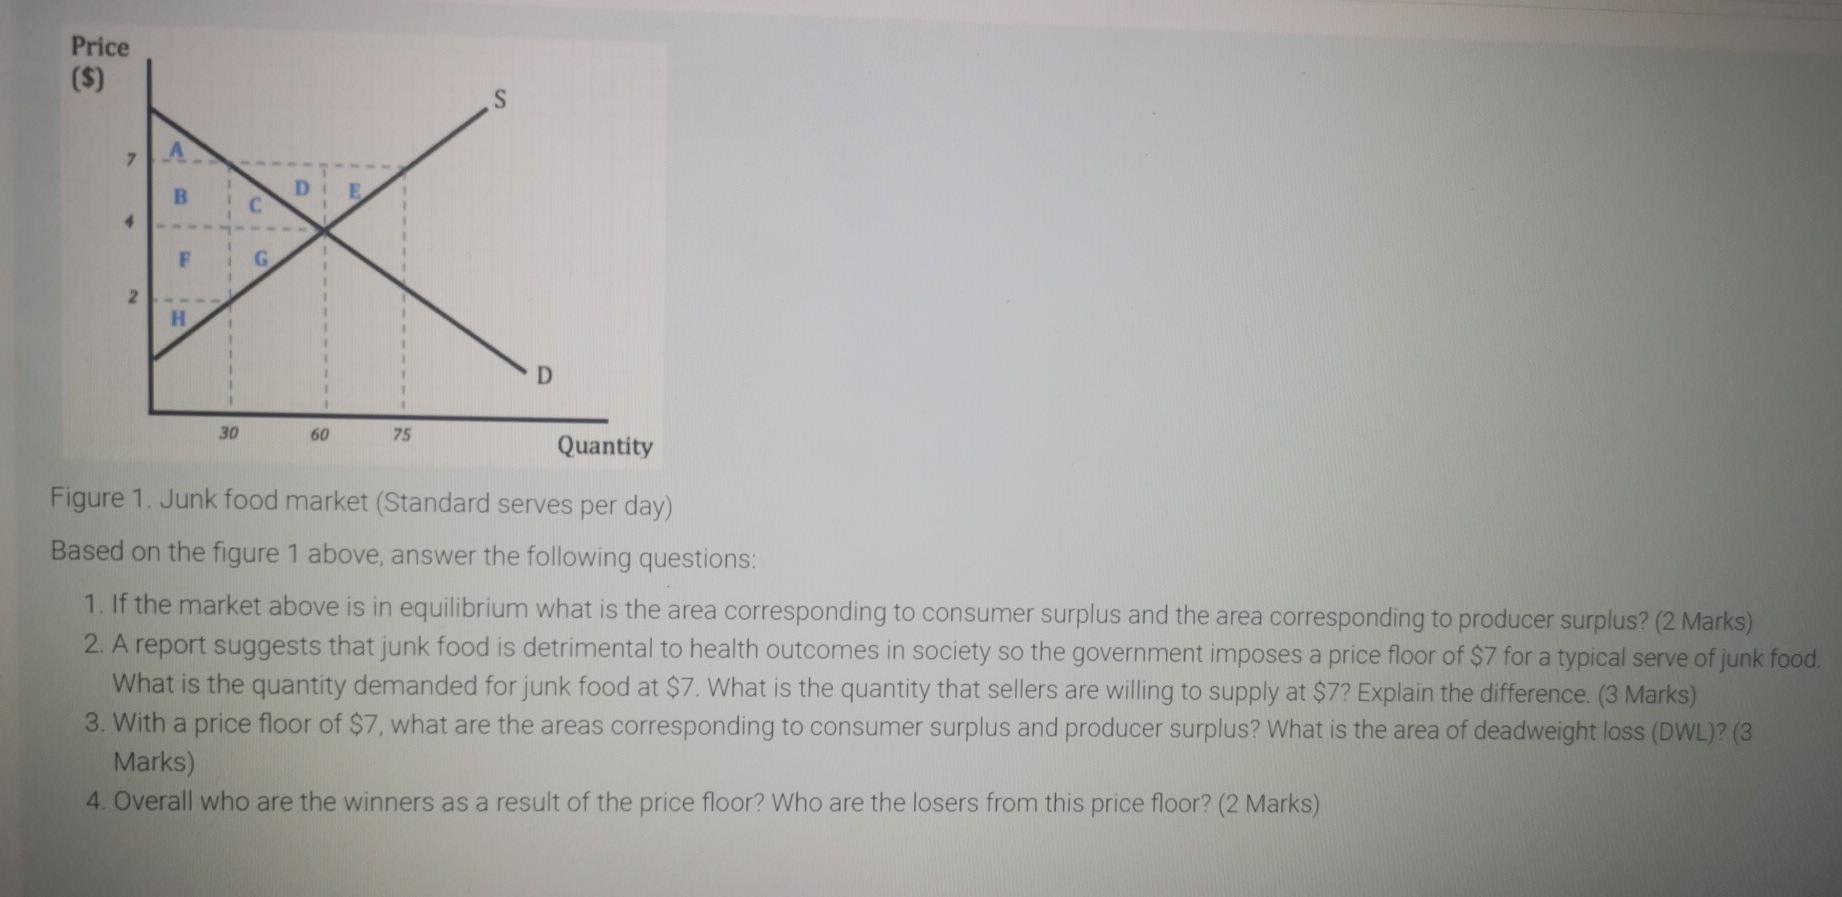
Price ($) S 7 D B E 4 F G 2 H D 30 60 75 Quantity Figure 1. Junk food market (Standard serves per day) Based on the figure 1 above, answer the following questions: 1. If the market above is in equilibrium what is the area corresponding to consumer surplus and the area corresponding to producer surplus? (2 Marks) 2. A report suggests that junk food is detrimental to health outcomes in society so the government imposes a price floor of $7 for a typical serve of junk food, What is the quantity demanded for junk food at $7. What is the quantity that sellers are willing to supply at $7? Explain the difference (3 Marks) 3. With a price floor of $7, what are the areas corresponding to consumer surplus and producer surplus? What is the area of deadweight loss (DWL)? (3 Marks) 4. Overall who are the winners as a result of the price floor? Who are the losers from this price floor? (2 Marks)
Step by Step Solution
There are 3 Steps involved in it

Get step-by-step solutions from verified subject matter experts