

Question: Principal components analysis (PCA) is a standard technique for dimensionality reduction. PCA provides a way to find a lower-dimensional representation of a dataset which preserves
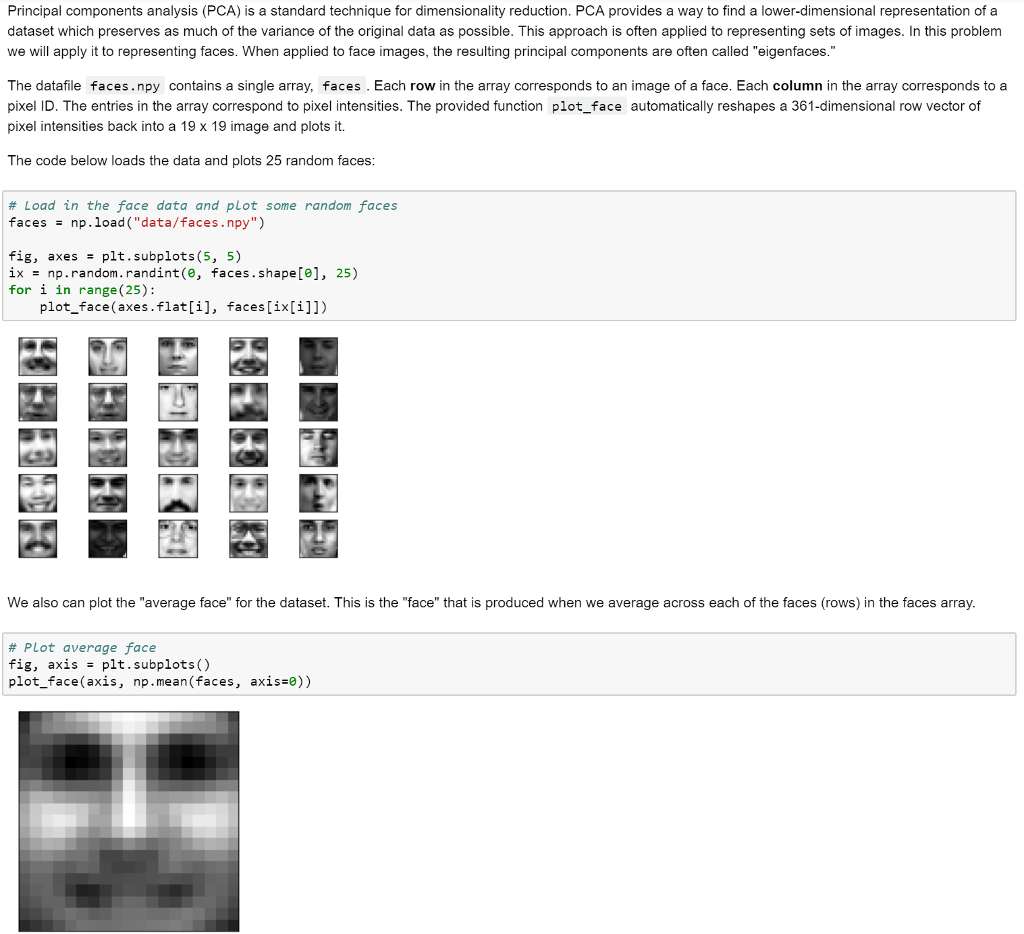
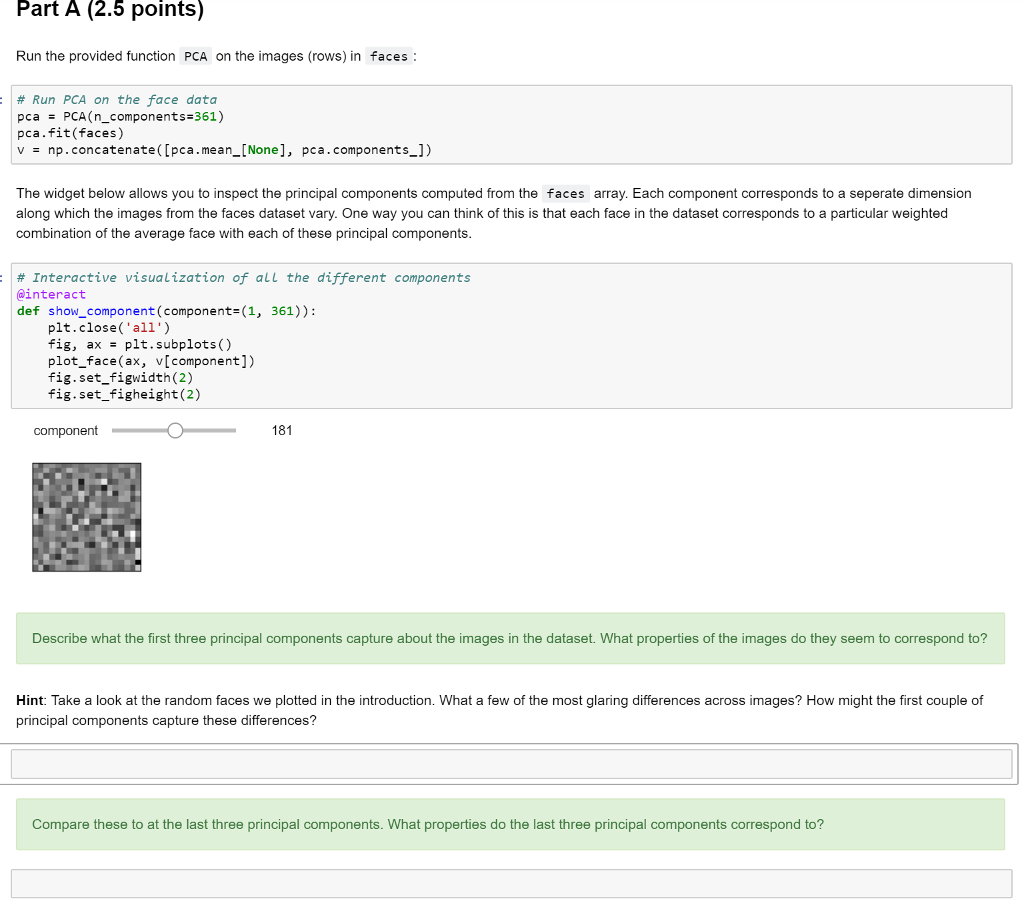
Principal components analysis (PCA) is a standard technique for dimensionality reduction. PCA provides a way to find a lower-dimensional representation of a dataset which preserves as much of the variance of the original data as possible. This approach is often applied to representing sets of images. In this problem we will apply it to representing faces. When applied to face images, the resulting principal components are often called "eigenfaces." The datafile faces.npy contains a single array, faces . Each row in the array corresponds to an image of a face. Each column in the array corresponds to a pixel ID. The entries in the array correspond to pixel intensities. The provided function plot_face automatically reshapes a 361-dimensional row vector of pixel intensities back into a 19 x 19 image and plots it. The code below loads the data and plots 25 random faces : # Load in the face data and plot some random faces facesnp.load ("data/faces.npy") fig, axesplt.subplots (5, 5) ix np.random.randint(e, faces.shape[e], 25) for i in range (25): plot face (axes.flat[i], faces[ix[i]]) We also can plot the "average face" for the dataset. This is the "face" that is produced when we average across each of the faces (rows) in the faces array. # Plot average face fig, axis -plt.subplots () plot_face(axis, np mean(faces, axis*e))
Step by Step Solution
There are 3 Steps involved in it

Get step-by-step solutions from verified subject matter experts