

Question: printed in the 31 2 Chapter 3 Case Problem 4: ROSEY'S ROSES You are to create a financial analysis for Rosey's Roses as of December
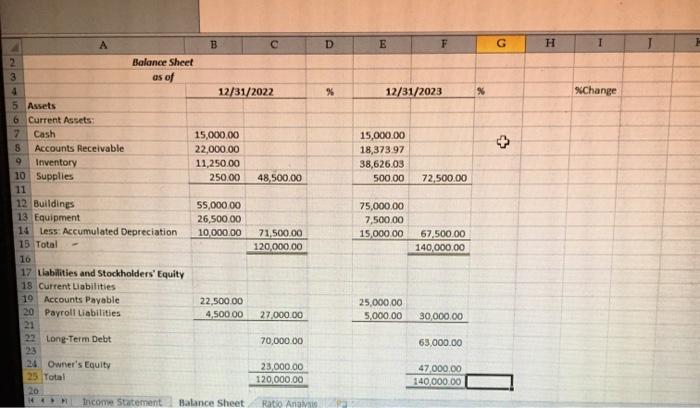
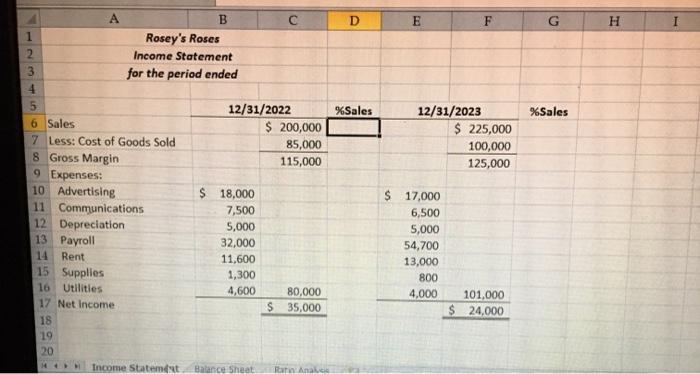
printed in the 31 2 Chapter 3 Case Problem 4: ROSEY'S ROSES You are to create a financial analysis for Rosey's Roses as of December 31, 2022, and December 31, 2023. Following the Chapter 3 examples, use the stu- dent file ch3-07.xls to create a vertical analysis of the balance sheet and income statement as of December 31, 2022, and December 31, 2023as well as a hori- zontal analysis of both the income statement and balance sheet comparing December 31, 2022, with December 31, 2023. Place the vertical analysis in columns D and G on the income statement labeled % of Sales in cells D5 and G5. Place the vertical analysis in columns D and G on the balance sheet labeled % of Assets in cells Ds and G5. Place the horizontal analysis in column I labeled % Change in cell 15 for both the income statement and balance sheet. Also create a pie chart of expenses for the year ended December 31, 2023, formatted in a manner similar to your chapter work; a column chart of expenses for the years ended December 31, 2022, and December 31, 2023, formatted in a D E F G H I % 12/31/2023 % Change + A B 2 Balance Sheet 3 as of 4 12/31/2022 5 Assets 6 Current Assets 7 Cash 15,000.00 8 Accounts Receivable 22,000.00 Inventory 11,250.00 10 Supplies 250.00 48,500.00 11 12 Buildings 55,000.00 13 Equipment 26,500.00 14 less: Accumulated Depreciation 10,000.00 71,500.00 15 Total 120,000.00 16 17 Liabilities and Stockholders' Equity 18 Current Liabilities 19 Accounts Payable 22,500.00 20 Payroll liabilities 4,500.00 27,000.00 15,000.00 18,37397 38,626.03 500.00 72,500.00 75,000.00 7,500.00 15,000.00 67,500.00 140,000.00 25,000.00 5,000.00 30,000.00 22 Long-Term Debt 70,000.00 63,000.00 24 Owner's Equity 23 Total 20 Income Statement 23,000.00 120,000.00 47 000 00 140,000.00 Balance Sheet Ratio Anal D E F G H %Sales %Sales 12/31/2023 $ 225,000 100,000 125,000 B 1 Rosey's Roses 2 Income Statement 3 for the period ended 4 5 12/31/2022 6 Sales $ 200,000 7 Less: Cost of Goods Sold 85,000 8 Gross Margin 115,000 9 Expenses: 10 Advertising $ 18,000 11 Communications 7,500 12 Depreciation 5,000 13 Payroll 32,000 14 Rent 11,600 15 Supplies 1,300 16 Utilities 4,600 80,000 17 Net Income $ 35,000 18 19 20 Income Statement Balance Sheet $ 17,000 6,500 5,000 54,700 13,000 800 4,000 101,000 $ 24,000 RT
Step by Step Solution
There are 3 Steps involved in it

Get step-by-step solutions from verified subject matter experts