

Question: Prior Knowledge Questions {Do these BEFORE using the Gizmo.) Mr. Bryant asks his students how far they live from school. and their travel time to
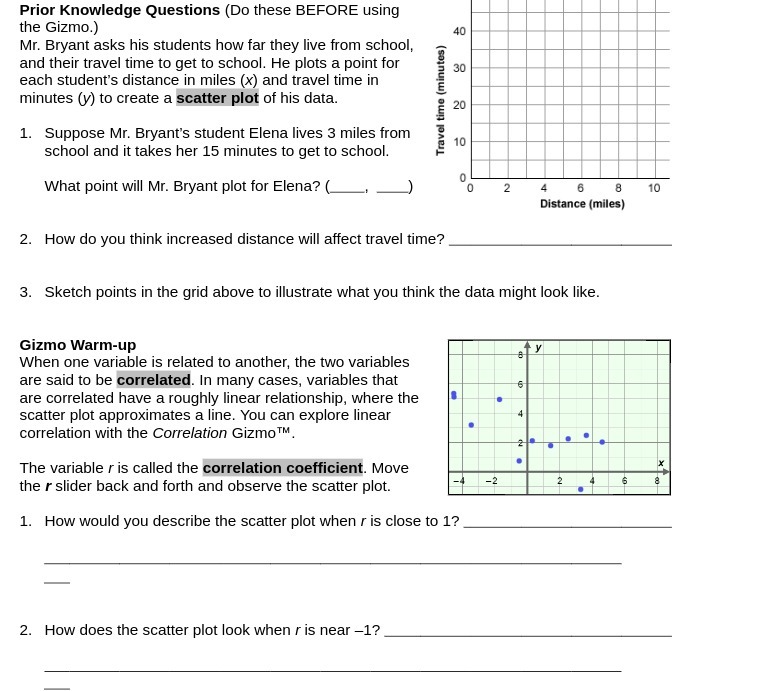
Prior Knowledge Questions {Do these BEFORE using the Gizmo.) Mr. Bryant asks his students how far they live from school. and their travel time to get to school. He plots a point for each student's distance in miles [x] and travel time in minutes (y) to create a _ of his data. 1. Suppose Mr. Bryant's student Elena lives 3 miles from school and it takes her 15 minutes to get to school. Tran! an. 1mm] What point will lvlr. Bryant plot for Elena? { . I: 2. How do you think increased distance will aect travel time? 3. Sketch points in the grid above to illustrate what you think the data might look like. Gizrno 1it'llarm-up: When one variable is related to another. the two variables are said to be _. In many cases, variables that are correlated have a roughly linear relationship, where the scatter plot approximates a line. You can explore linear correlation with the Correlation lIIE-izmoT'\". The variable r is called the . Move the r slider back and forth and observe the scatter plot. 1. How would you describe the scatter plot when r is close to 1? 2. How does the scatter plot look when r is neat 1
Step by Step Solution
There are 3 Steps involved in it

Get step-by-step solutions from verified subject matter experts