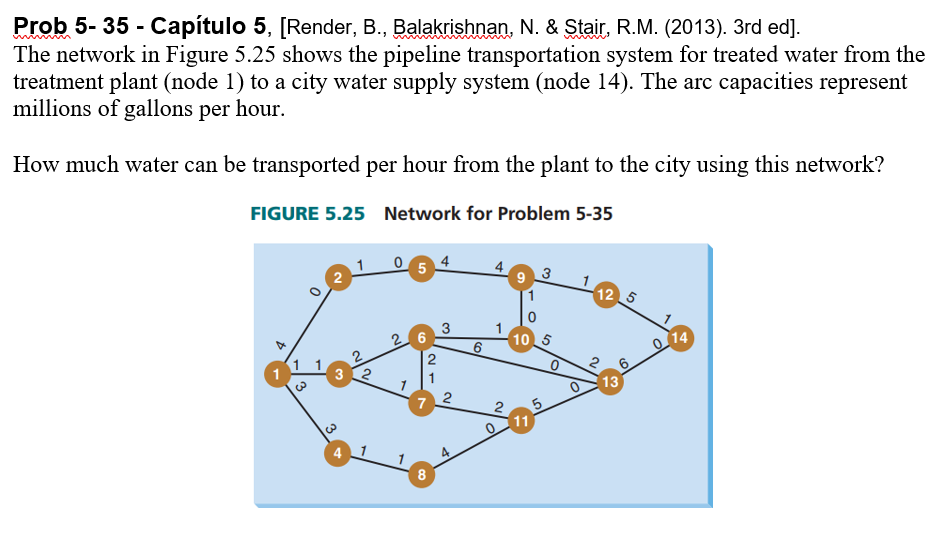
Question: Prob 5-35 - Captulo 5, [Render, B., Balakrishnan, N. & Stair, R.M. (2013). 3rd ed]. The network in Figure 5.25 shows the pipeline transportation system

Prob 5-35 - Captulo 5, [Render, B., Balakrishnan,

Prob 5-35 - Captulo 5, [Render, B., Balakrishnan, N. & Stair, R.M. (2013). 3rd ed]. The network in Figure 5.25 shows the pipeline transportation system for treated water from the treatment plant (node 1) to a city water supply system (node 14). The arc capacities represent millions of gallons per hour. How much water can be transported per hour from the plant to the city using this network? FIGURE 5.25 Network for Problem 5-35 5 2 3 12 5 3 0 105 14 6 2 1 1 32 2 1 o 1 13 2 7 5 11 8

Step by Step Solution

There are 3 Steps involved in it

1 Expert Approved Answer
Step: 1 Unlock blur-text-image
Question Has Been Solved by an Expert!

Get step-by-step solutions from verified subject matter experts

Step: 2 Unlock
Step: 3 Unlock

Students Have Also Explored These Related General Management Questions!