

Question: Probability 10. 4. (a) A sample consisting of 100 randomly-selected adults in the USA was classified in terms of their political affiliation (Democrat or Republican)
Probability 10.
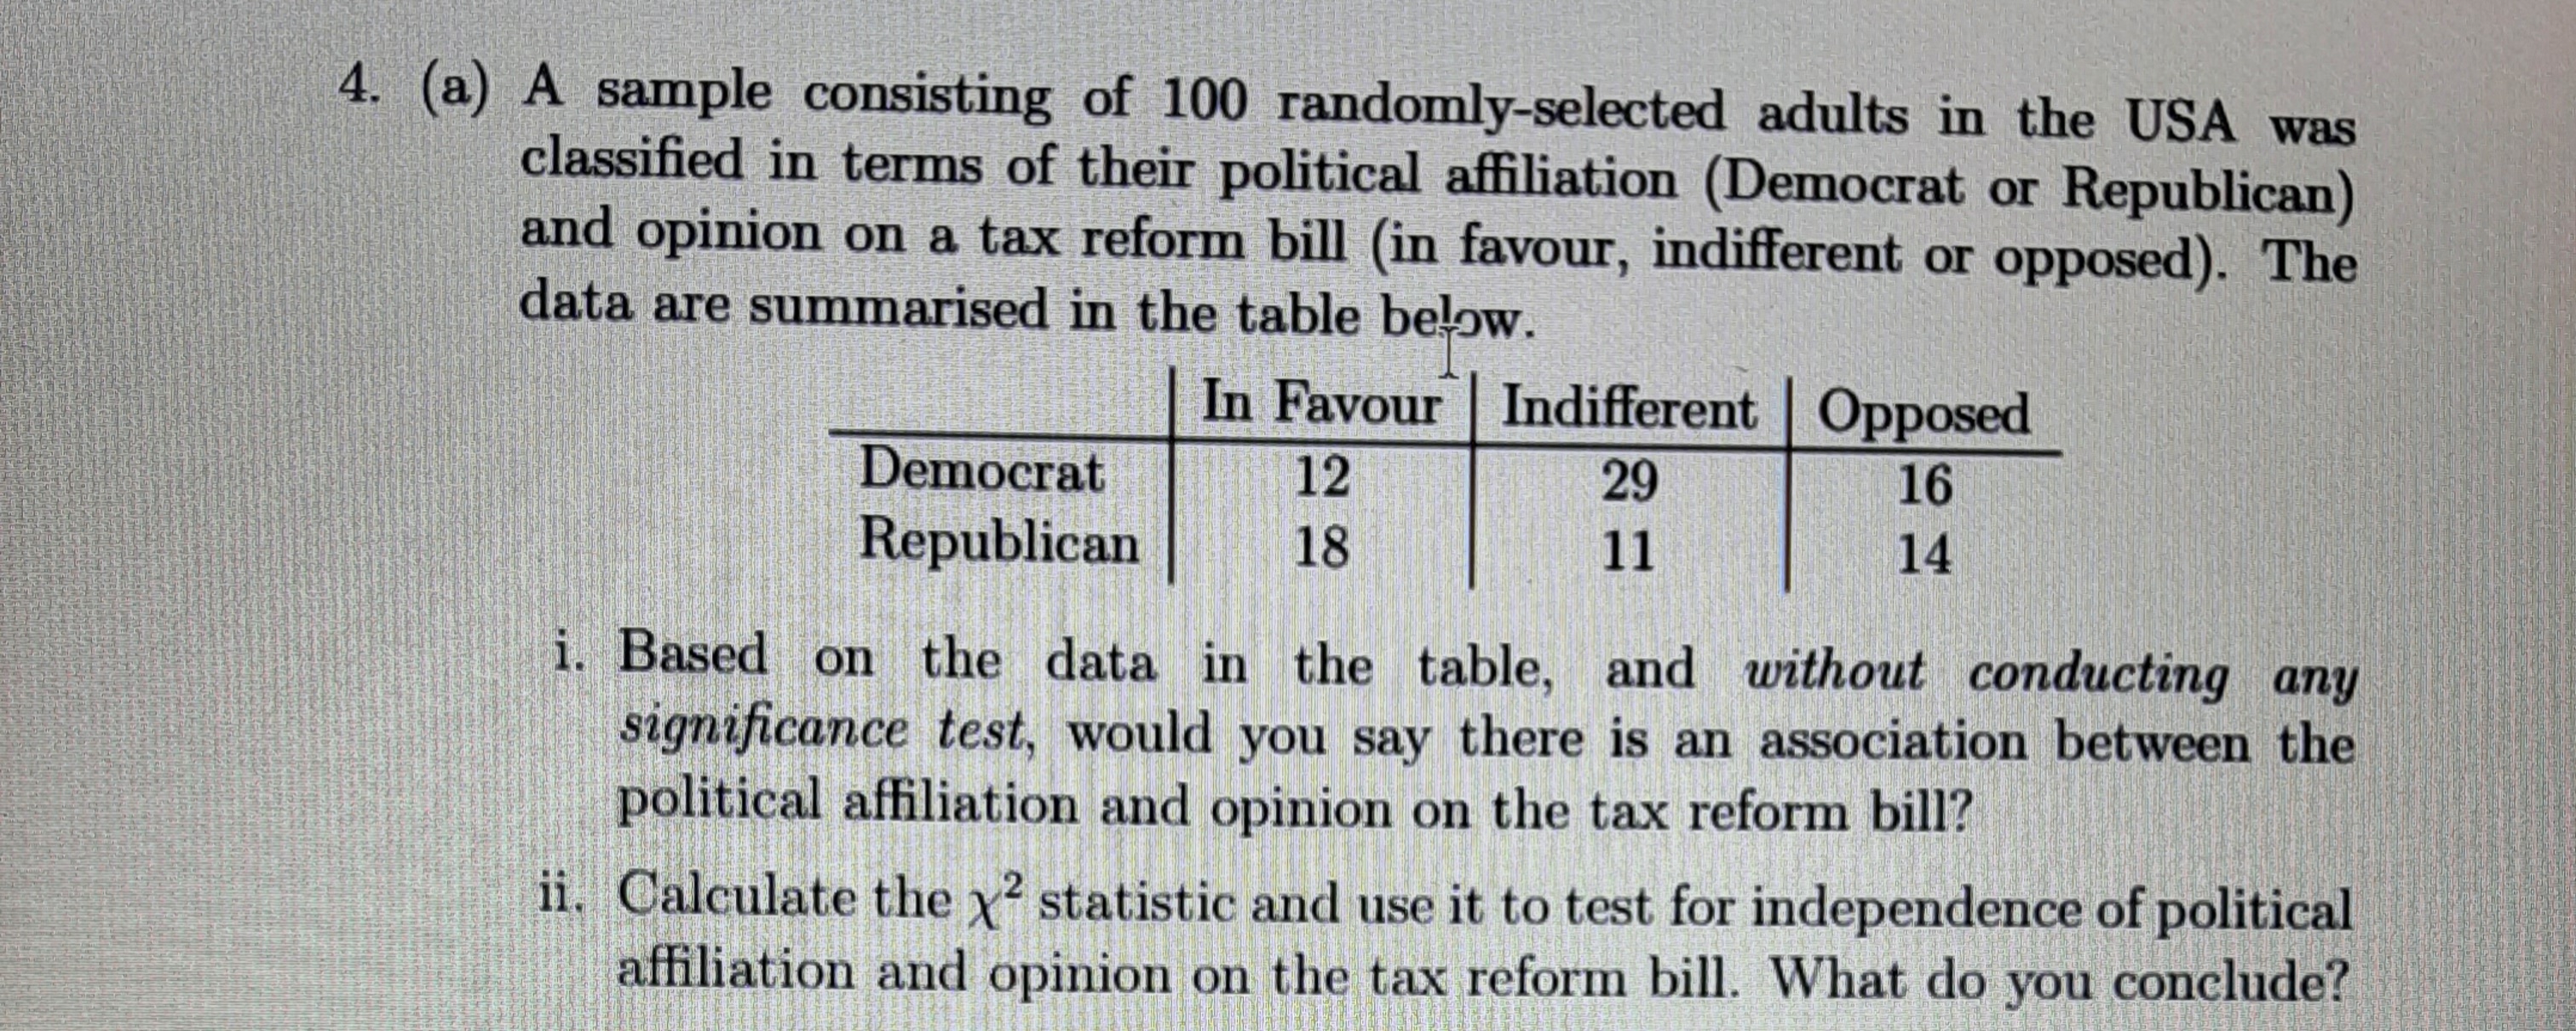
4. (a) A sample consisting of 100 randomly-selected adults in the USA was classified in terms of their political affiliation (Democrat or Republican) and opinion on a tax reform bill (in favour, indifferent or opposed). The data are summarised in the table below. In Favour Indifferent Opposed Democrat 12 29 16 Republican 18 11 14 i. Based on the data in the table, and without conducting any significance test, would you say there is an association between the political affiliation and opinion on the tax reform bill? ii. Calculate the x2 statistic and use it to test for independence of political affiliation and opinion on the tax reform bill. What do you conclude
Step by Step Solution
There are 3 Steps involved in it

Get step-by-step solutions from verified subject matter experts