

Question: Probability 6. 2. (a) The data below represent the weights (in kg) of 30 athletes. 57 59 61 63 64 65 73 74 74 74
Probability 6.
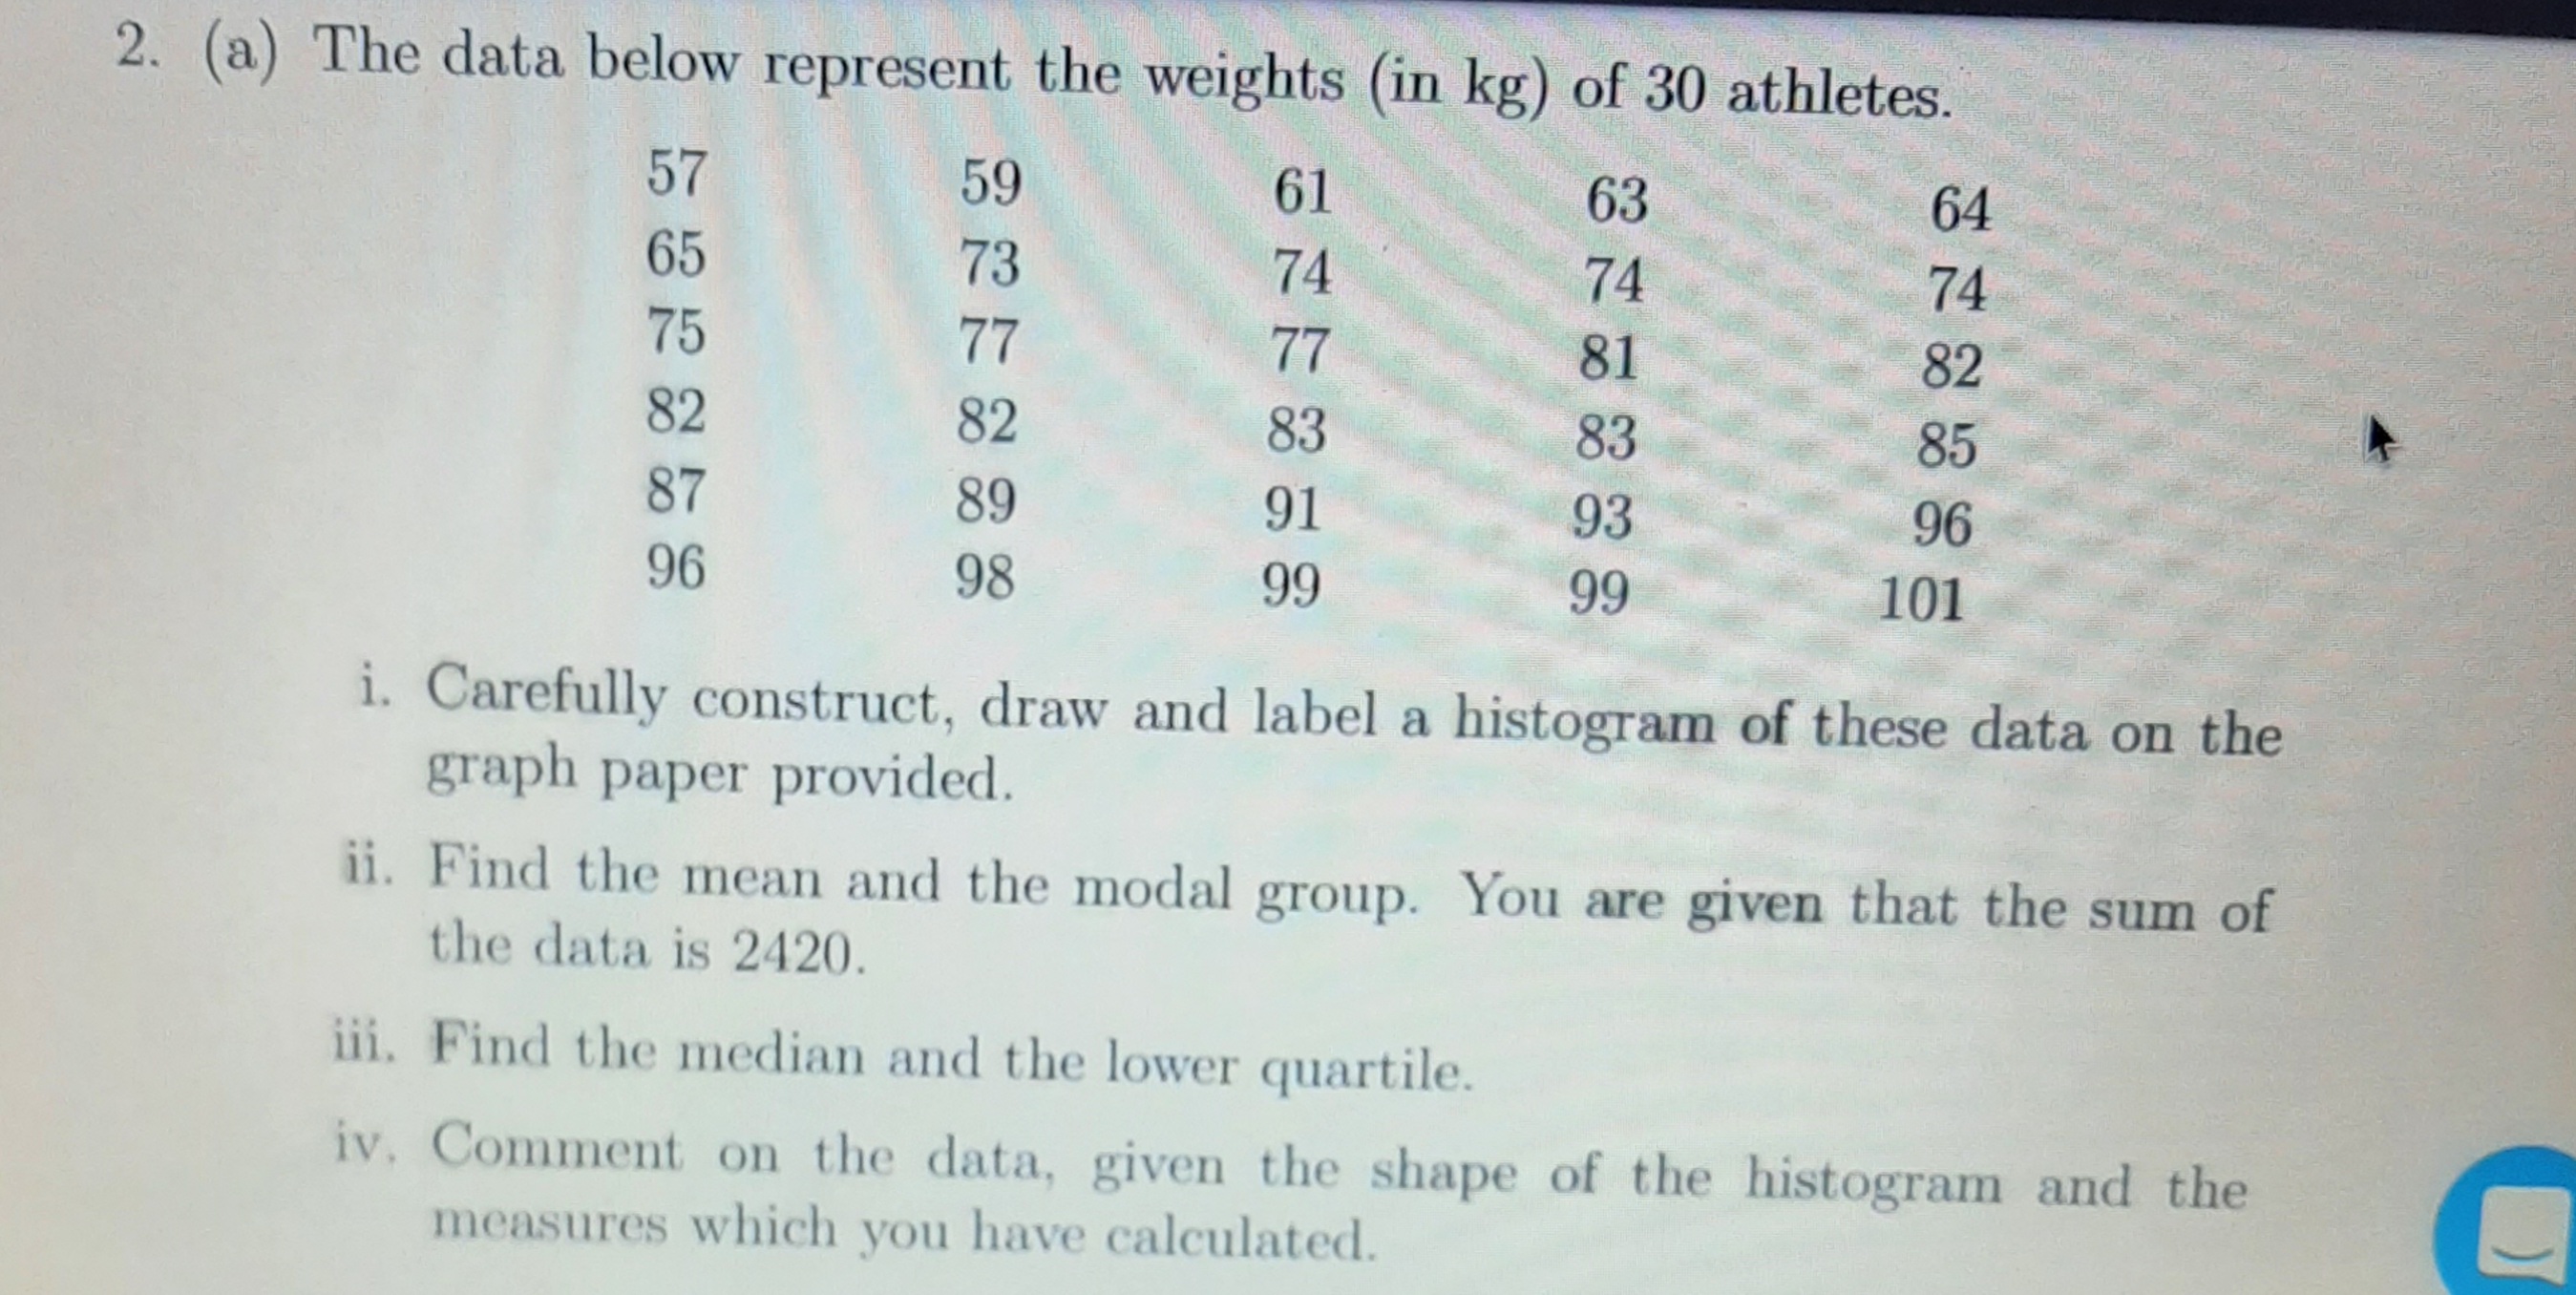
2. (a) The data below represent the weights (in kg) of 30 athletes. 57 59 61 63 64 65 73 74 74 74 75 77 77 81 82 82 82 83 83 85 87 89 91 93 96 96 98 99 99 101 i. Carefully construct, draw and label a histogram of these data on the graph paper provided. ii. Find the mean and the modal group. You are given that the sum of the data is 2420. ii. Find the median and the lower quartile. iv. Comment on the data, given the shape of the histogram and the measures which you have calculated
Step by Step Solution
There are 3 Steps involved in it
1 Expert Approved Answer
Step: 1 Unlock

Question Has Been Solved by an Expert!
Get step-by-step solutions from verified subject matter experts
Step: 2 Unlock
Step: 3 Unlock