

Question: Probability and statistics thanks *# 4. (5+5=10 points) Discrete Distribution A survey was conducted among 200 students on campus regarding the number of parking tickets
Probability and statistics thanks
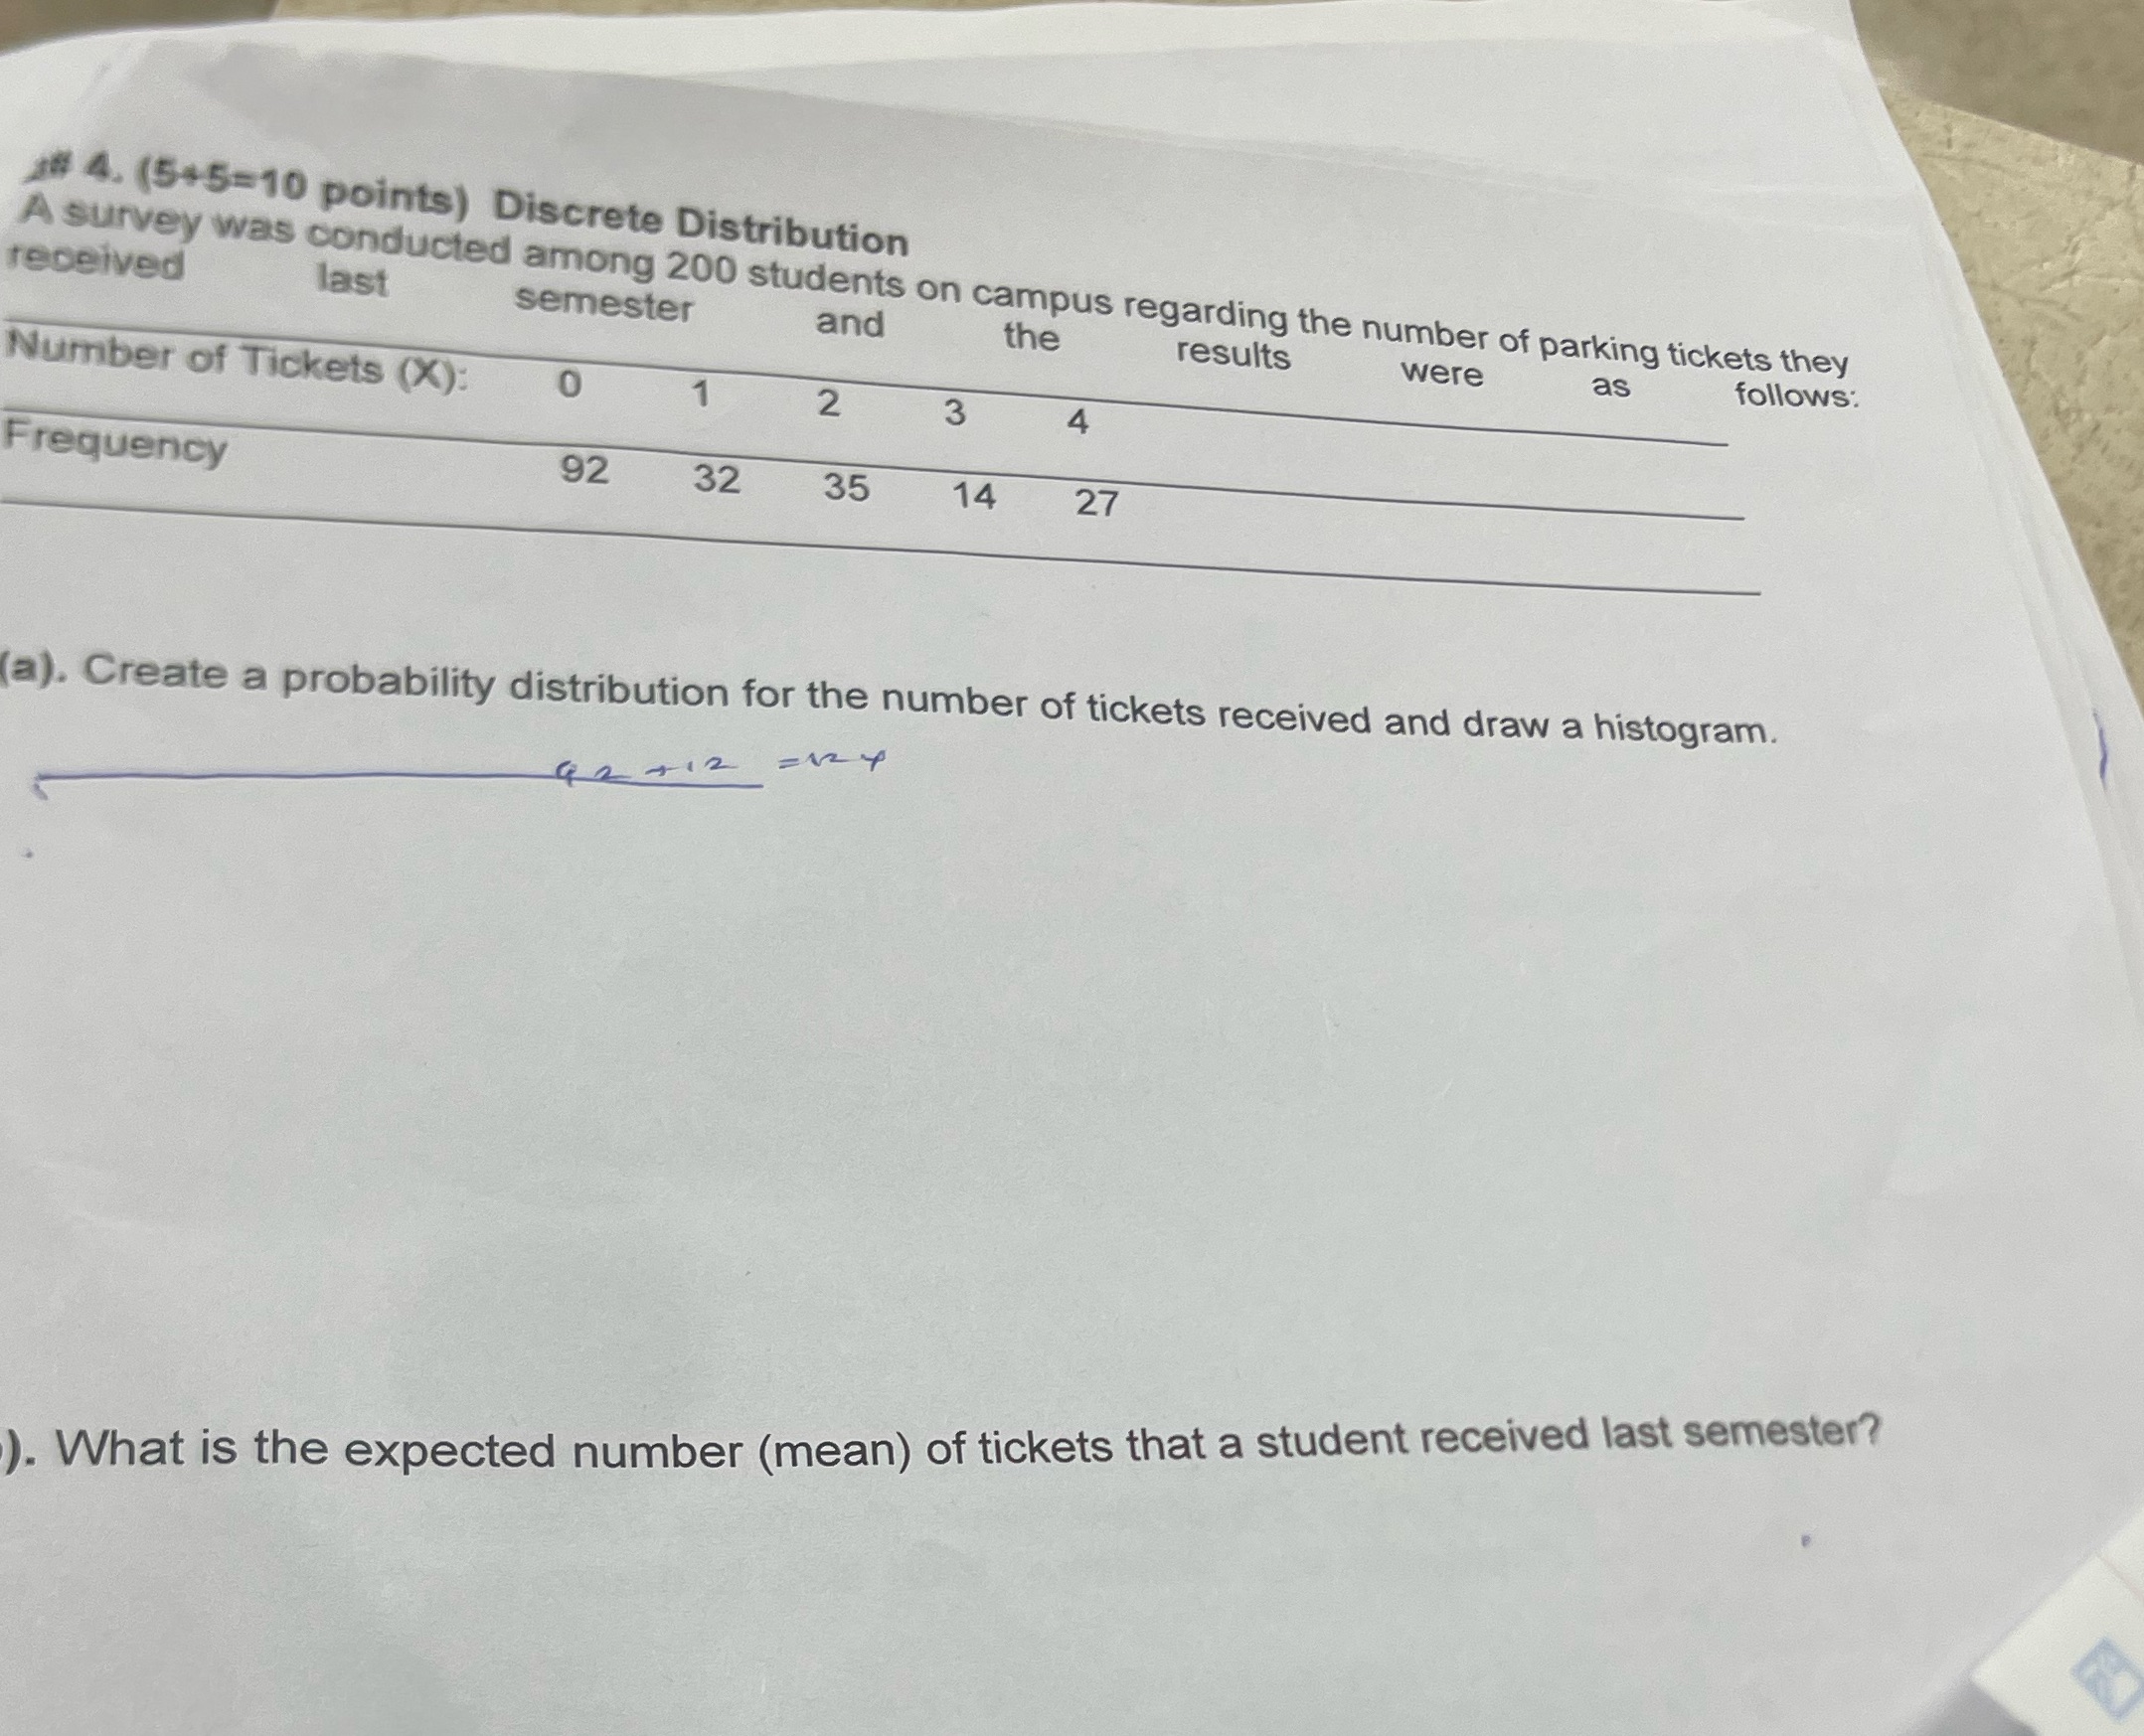
*# 4. (5+5=10 points) Discrete Distribution A survey was conducted among 200 students on campus regarding the number of parking tickets they received last semester and the results were as follows : Number of Tickets (X): 0 1 2 3 4 Frequency 92 32 35 14 27 (a). Create a probability distribution for the number of tickets received and draw a histogram. 42 412 = 124 ). What is the expected number (mean) of tickets that a student received last semester
Step by Step Solution
There are 3 Steps involved in it
1 Expert Approved Answer
Step: 1 Unlock

Question Has Been Solved by an Expert!
Get step-by-step solutions from verified subject matter experts
Step: 2 Unlock
Step: 3 Unlock