

Question: Probability B A Loss The graph above depicts the probability distributions for risks A and B. Based on the graph, which of the following statements
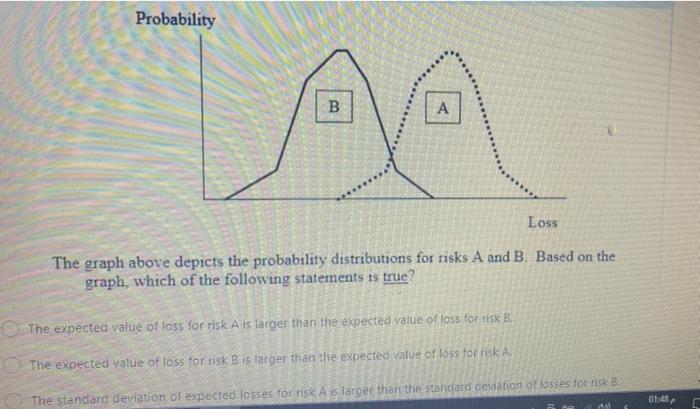
Probability B A Loss The graph above depicts the probability distributions for risks A and B. Based on the graph, which of the following statements is true? The expected value of loss for risk A is larger than the expected value of loss for nisk B. The expected value of loss for risk B is larger than the expected value of loss for SA The standard deviation of expected losses for risk A is larger than the standard deviation of losses for riske 01:48
Step by Step Solution
There are 3 Steps involved in it
1 Expert Approved Answer
Step: 1 Unlock

Question Has Been Solved by an Expert!
Get step-by-step solutions from verified subject matter experts
Step: 2 Unlock
Step: 3 Unlock