

Question: Probability questions: Question 4 0/12 pts 9 3 99 The following joint frequency distribution table shows responses from a sample of 216 unionized employees on
Probability questions:
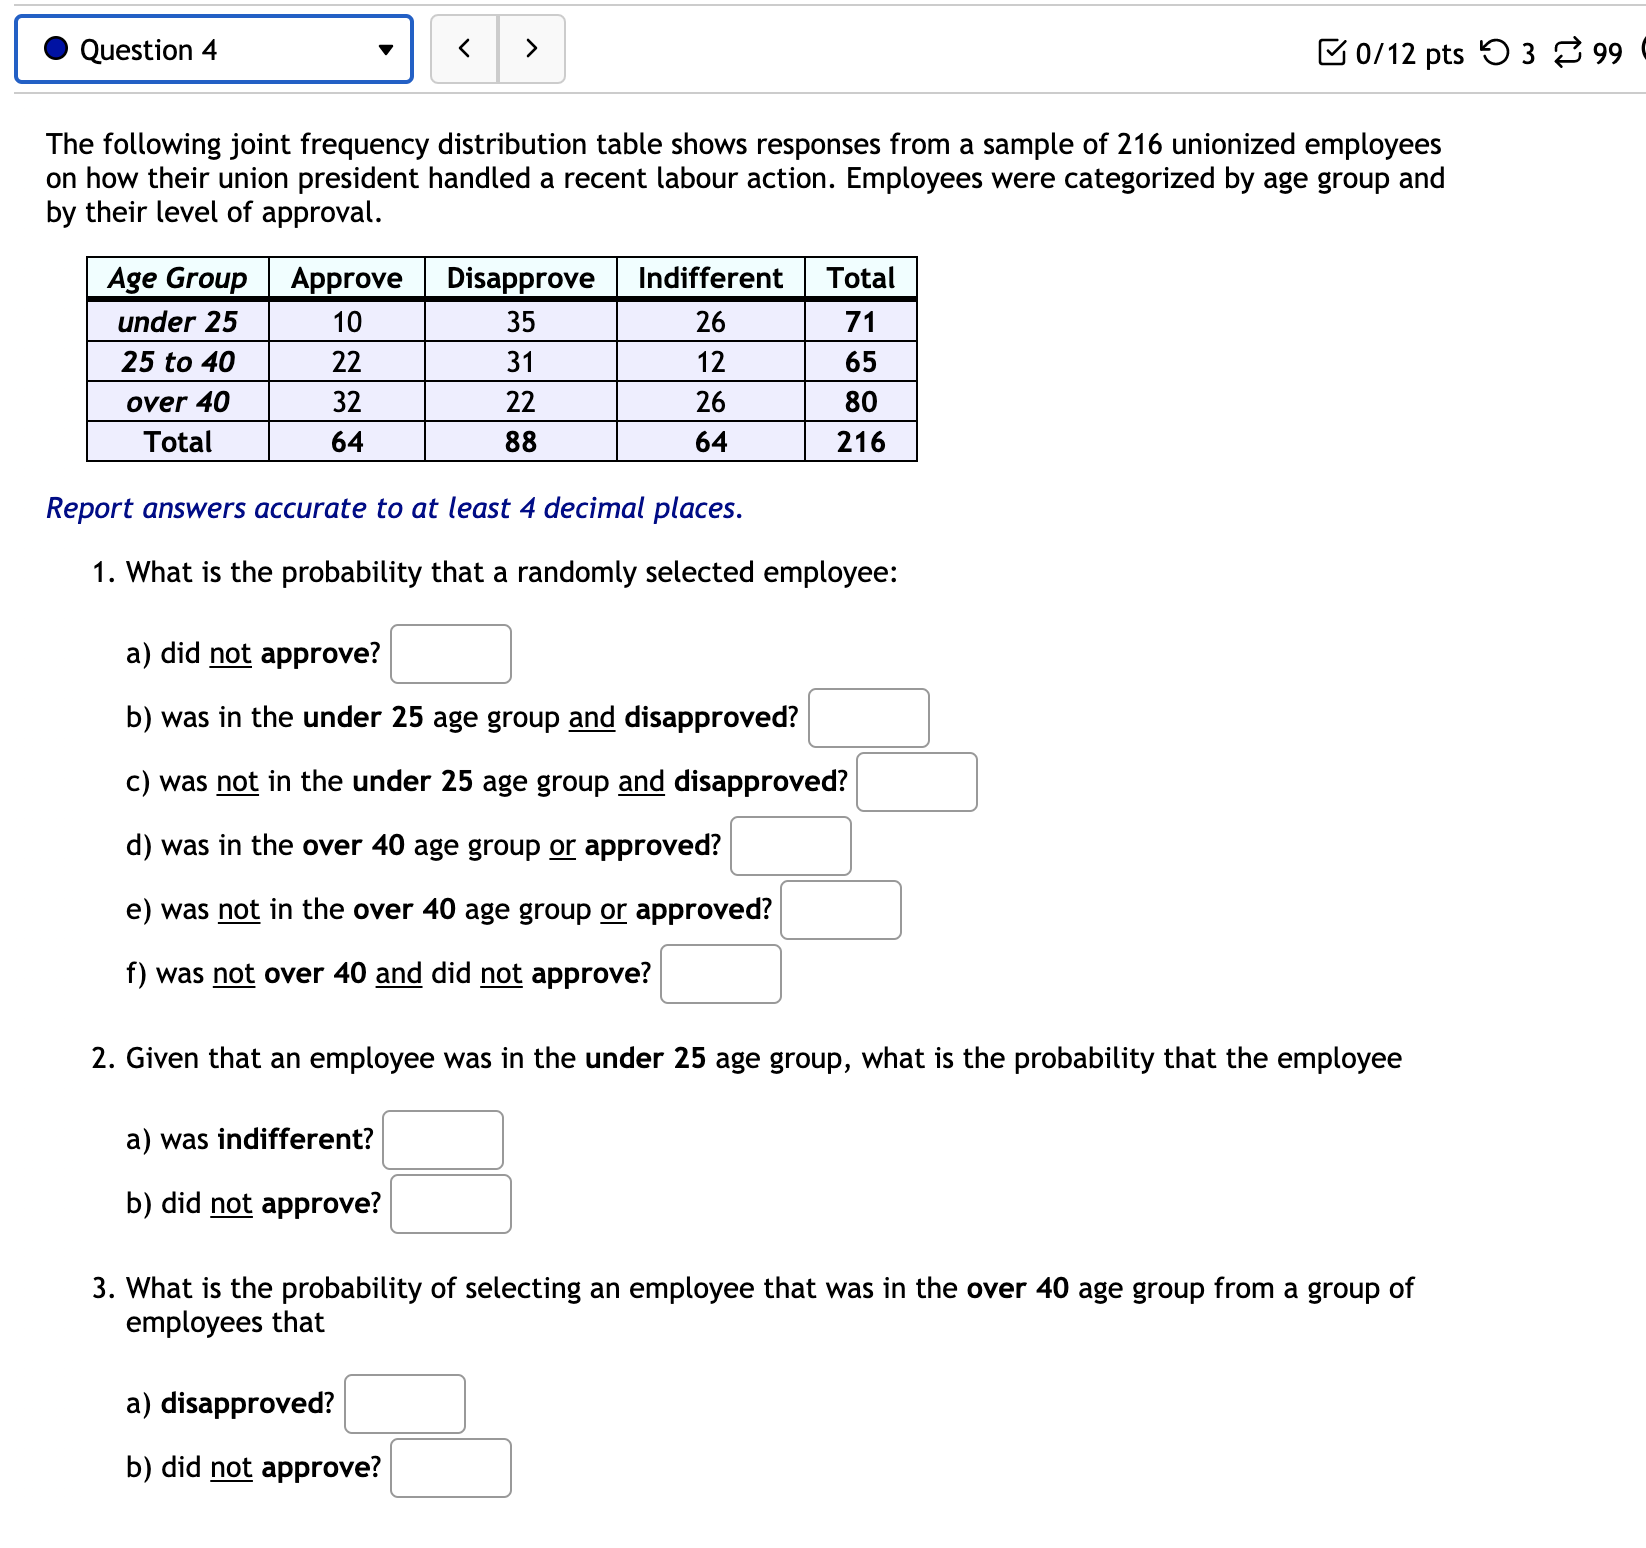
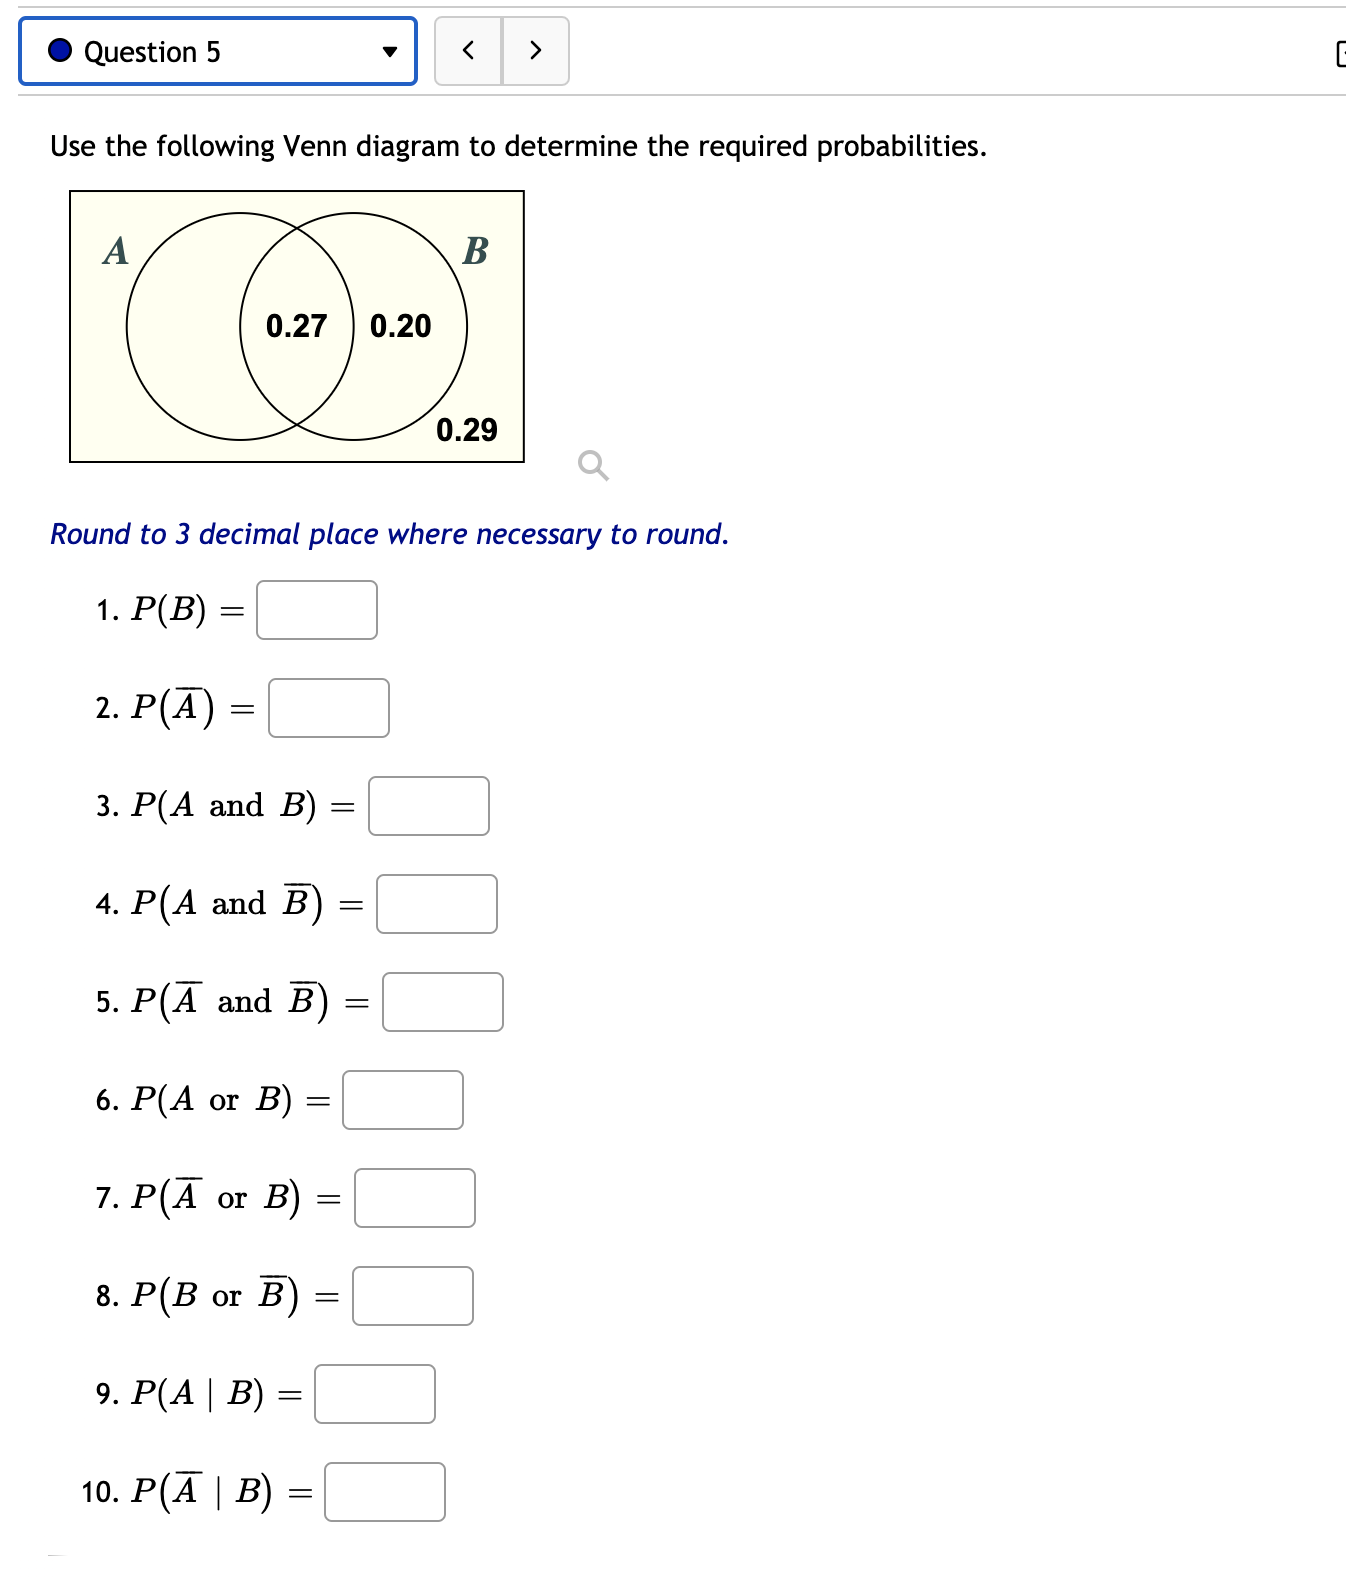
Question 4 0/12 pts 9 3 99 The following joint frequency distribution table shows responses from a sample of 216 unionized employees on how their union president handled a recent labour action. Employees were categorized by age group and by their level of approval. Age Group Approve Disapprove Indifferent Total under 25 10 35 26 71 25 to 40 22 31 12 65 over 40 32 22 26 Total 64 38 64 216 Report answers accurate to at least 4 decimal places. 1. What is the probability that a randomly selected employee: a) did not approve? b) was in the under 25 age group and disapproved? c) was not in the under 25 age group and disapproved? d) was in the over 40 age group or approved? e) was not in the over 40 age group or approved? f) was not over 40 and did not approve? 2. Given that an employee was in the under 25 age group, what is the probability that the employee a) was indifferent? b) did not approve? 3. What is the probability of selecting an employee that was in the over 40 age group from a group of employees that a) disapproved? b) did not approve?Question 5 Use the following Venn diagram to determine the required probabilities. A B 0.27 0.20 0.29 Q Round to 3 decimal place where necessary to round. 1. P(B) 2. P(A) = 3. P(A and B) 4. P( A and B) = 5. P(A and B) = 6. P(A or B) = 7. P(A or B) = 8. P (B or B) = 9. P(A | B) = 10. P(A | B) =
Step by Step Solution
There are 3 Steps involved in it

Get step-by-step solutions from verified subject matter experts