

Question: Probability/Statistics Name More Scatter Plot Practice Chapter 7 Day 2 Date Block 1. Describe the graph: 60 CO 15 12.5 25.0 37.5 50.0 0.0 Protein
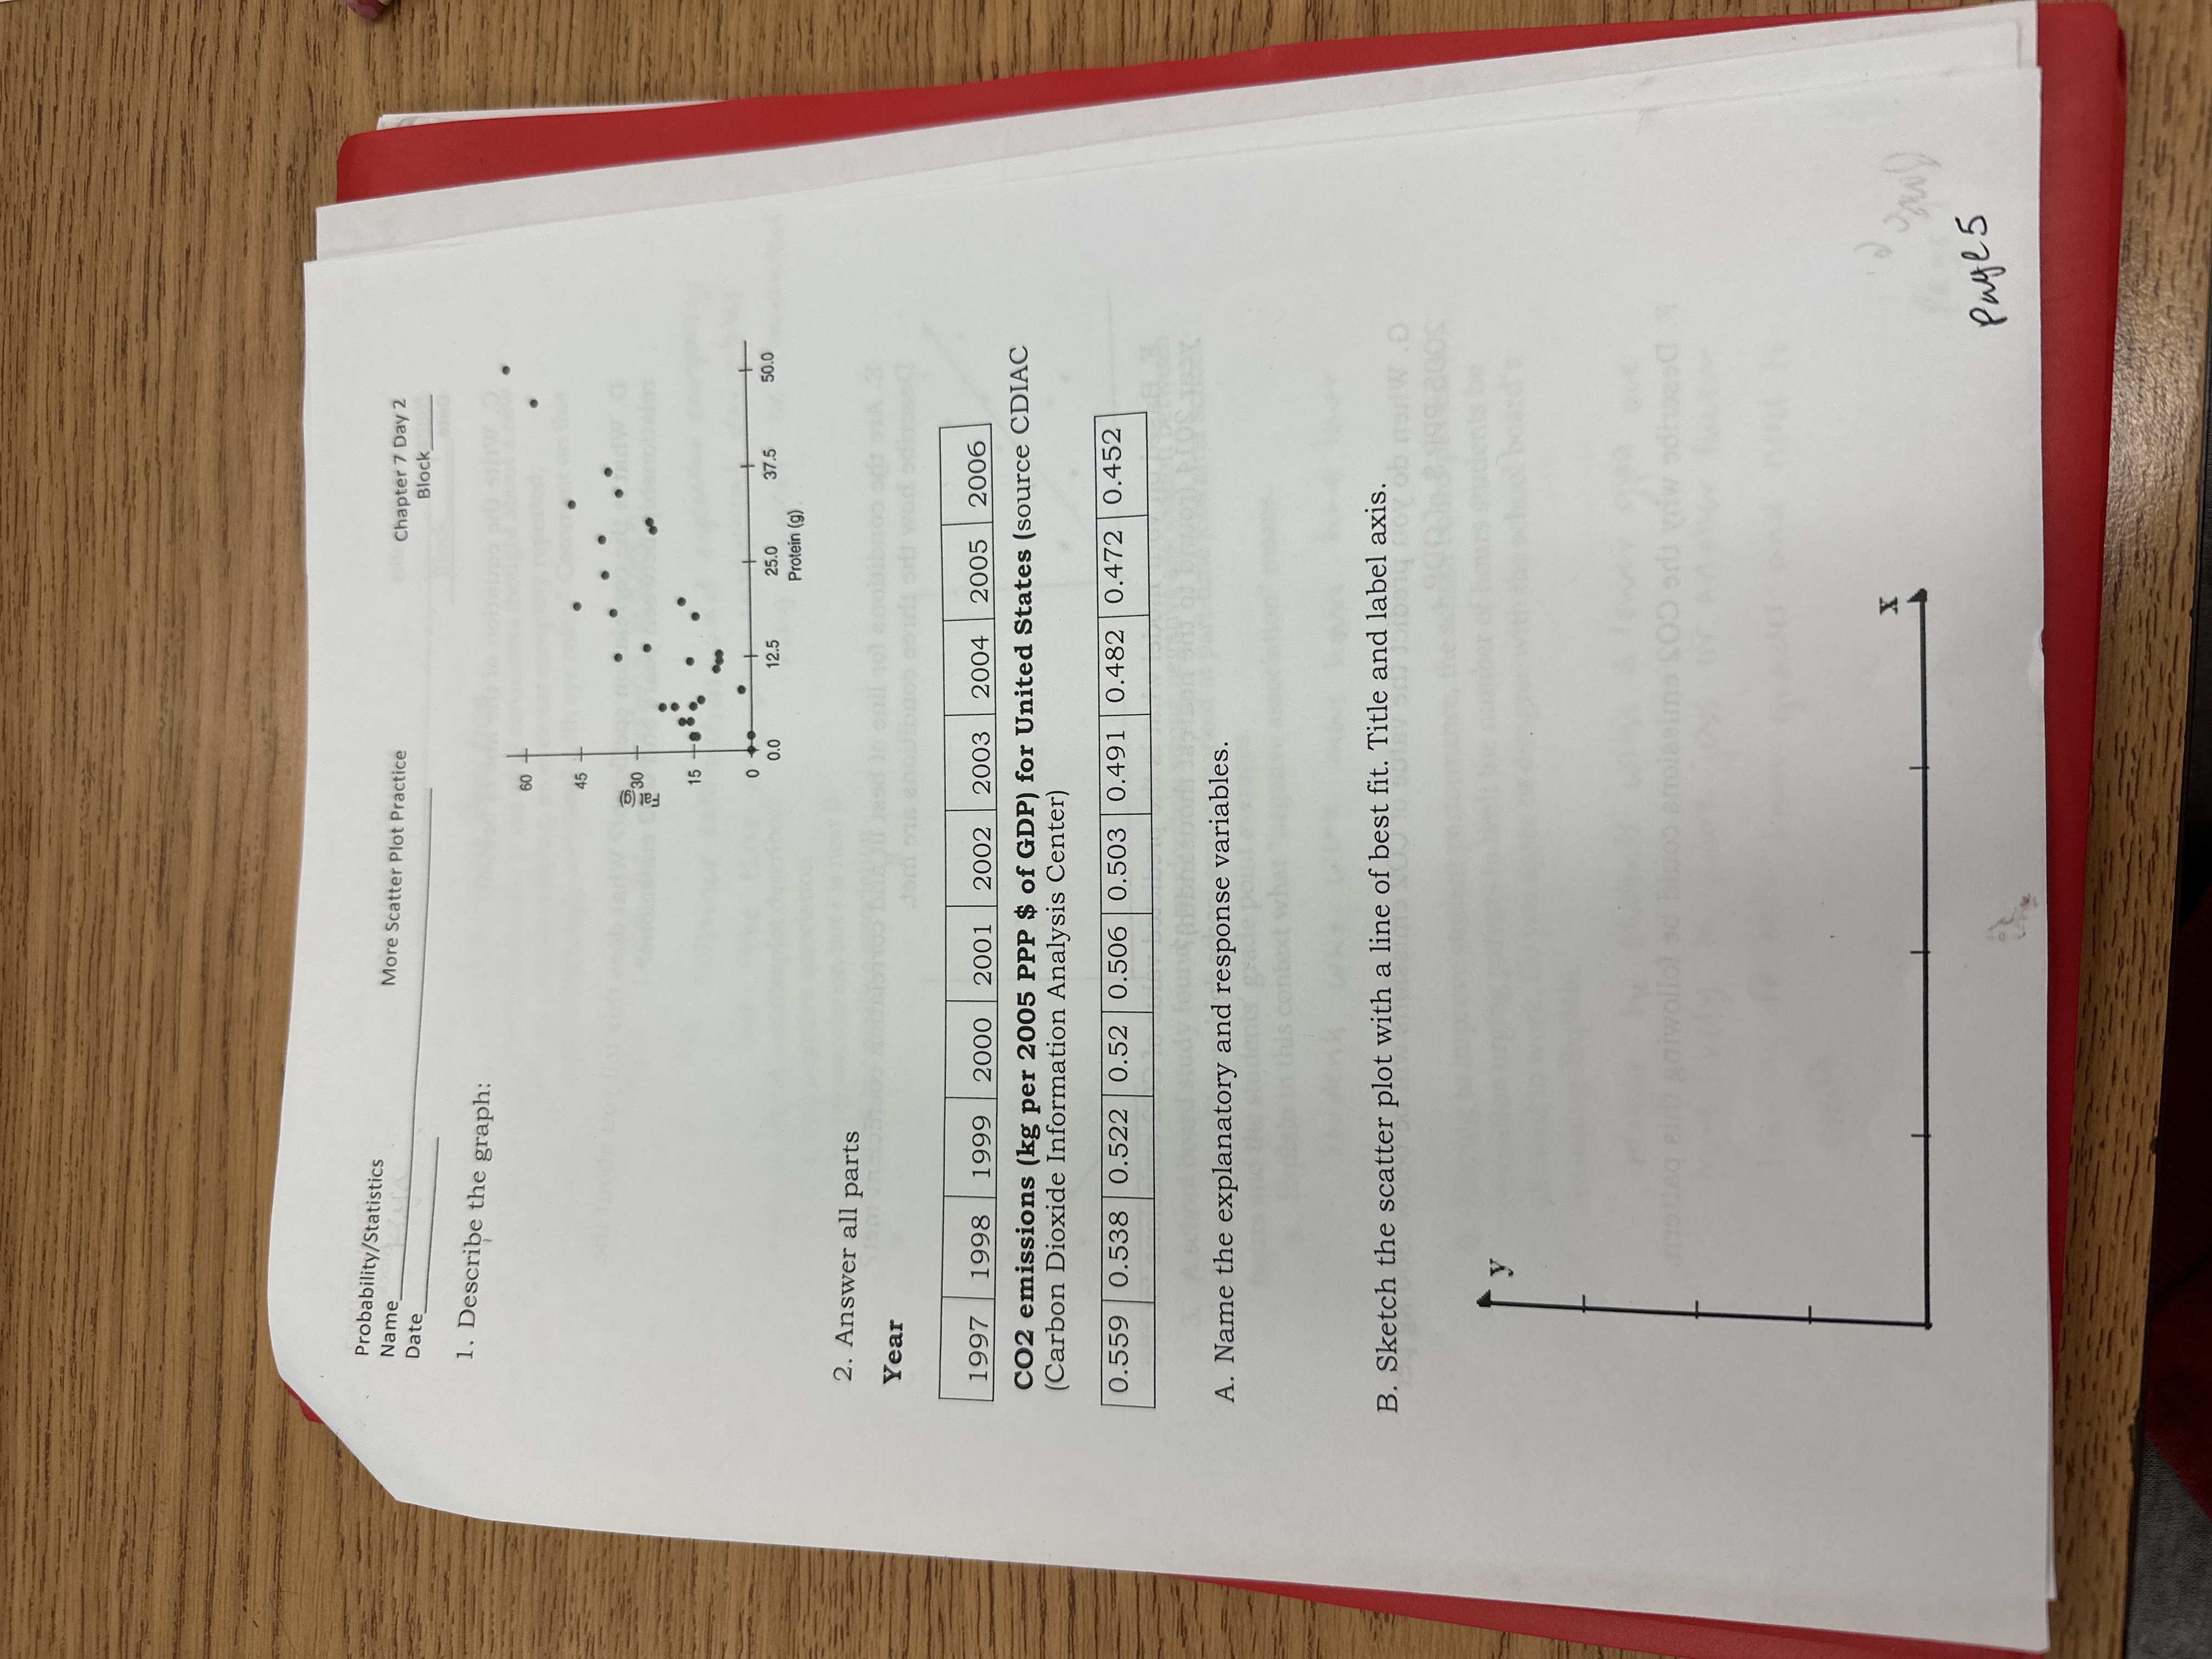
Probability/Statistics Name More Scatter Plot Practice Chapter 7 Day 2 Date Block 1. Describe the graph: 60 CO 15 12.5 25.0 37.5 50.0 0.0 Protein (9) 2. Answer all parts Year 1997 1998 1999 2000 2001 2002 2003 2004 2005 2006 CO2 emissions (kg per 2005 PPP $ of GDP) for United States (source CDIAC (Carbon Dioxide Information Analysis Center) 0.559 0.538 0.522 0.52 0.506 0.503 0.491 0.482 0.472 0.452 A. Name the explanatory and response variables. B. Sketch the scatter plot with a line of best fit. Title and label axis. 6 norW .D students Daniwollot ed bitoo enolasims SOO ard vow edhead Page 5
Step by Step Solution
There are 3 Steps involved in it
1 Expert Approved Answer
Step: 1 Unlock

Question Has Been Solved by an Expert!
Get step-by-step solutions from verified subject matter experts
Step: 2 Unlock
Step: 3 Unlock