

Question: Problem 04-10 (algo) Use the demand schedule, graph, and the elasticity formula to answer one question. Quantity Price Demanded E Total Revenue $ 0.50 1
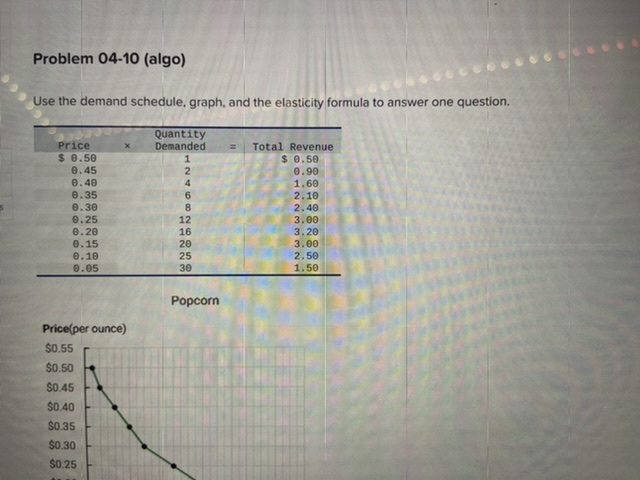
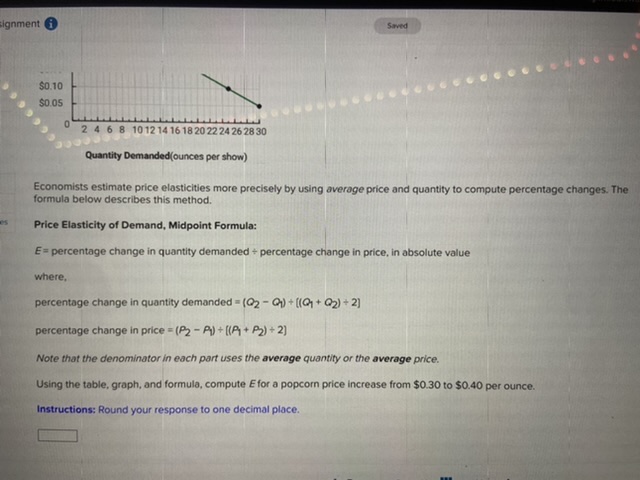
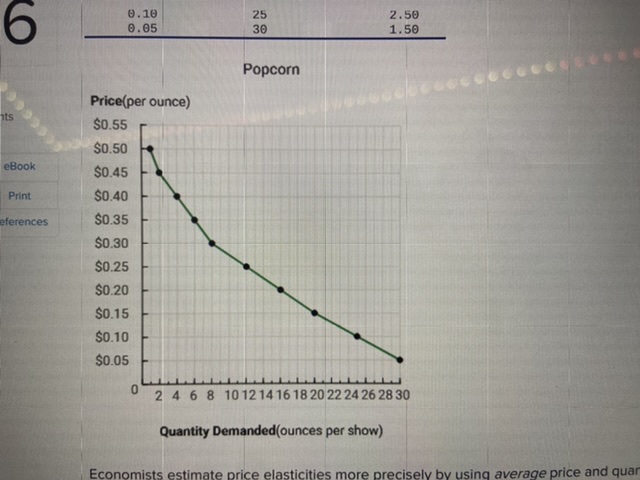
Problem 04-10 (algo) Use the demand schedule, graph, and the elasticity formula to answer one question. Quantity Price Demanded E Total Revenue $ 0.50 1 $ 0.50 0. 45 0.90 0.48 4 1.60 0.35 6 2.10 0.30 8 2.40 0. 25 12 3.00 0. 20 16 3.20 0. 15 20 3.00 0.10 25 2.50 0.05 30 1.50 Popcorn Price(per ounce) $0.55 $0.50 SO.45 $0.40 $0.35 $0.30 $0.25signment $0.10 $0.05 2 4 6 8 10 12 14 16 18 20 22 24 26 28 30 Quantity Demanded(ounces per show) Economists estimate price elasticities more precisely by using average price and quantity to compute percentage changes. The formula below describes this method. Price Elasticity of Demand, Midpoint Formula: E= percentage change in quantity demanded + percentage change in price, in absolute value where, percentage change in quantity demanded = (02 - QJ) + [(Q1 + 02) + 2] percentage change in price = (P2 - P) + [(A + P2) + 2] Note that the denominator in each part uses the average quantity or the average price. Using the table, graph, and formula, compute E for a popcorn price increase from $0.30 to $0.40 per ounce. Instructions: Round your response to one decimal place.6 0 . 10 25 2.50 0.05 30 1.50 Popcorn Price(per ounce) it's SO.55 $0.50 eBook SO.45 Print $0.40 eferences $0.35 $0.30 $0.25 $0.20 $0.15 $0.10 $0.05 0 2 4 6 8 10 12 14 16 18 20 22 24 26 28 30 Quantity Demanded(ounces per show) Economists estimate price elasticities more precisely by using average price and quar
Step by Step Solution
There are 3 Steps involved in it

Get step-by-step solutions from verified subject matter experts