

Question: Problem 06-05 For the pizza seller whose marginal, average variable, and average total cost curves are shown in the graph below, what is the profit-maximizing
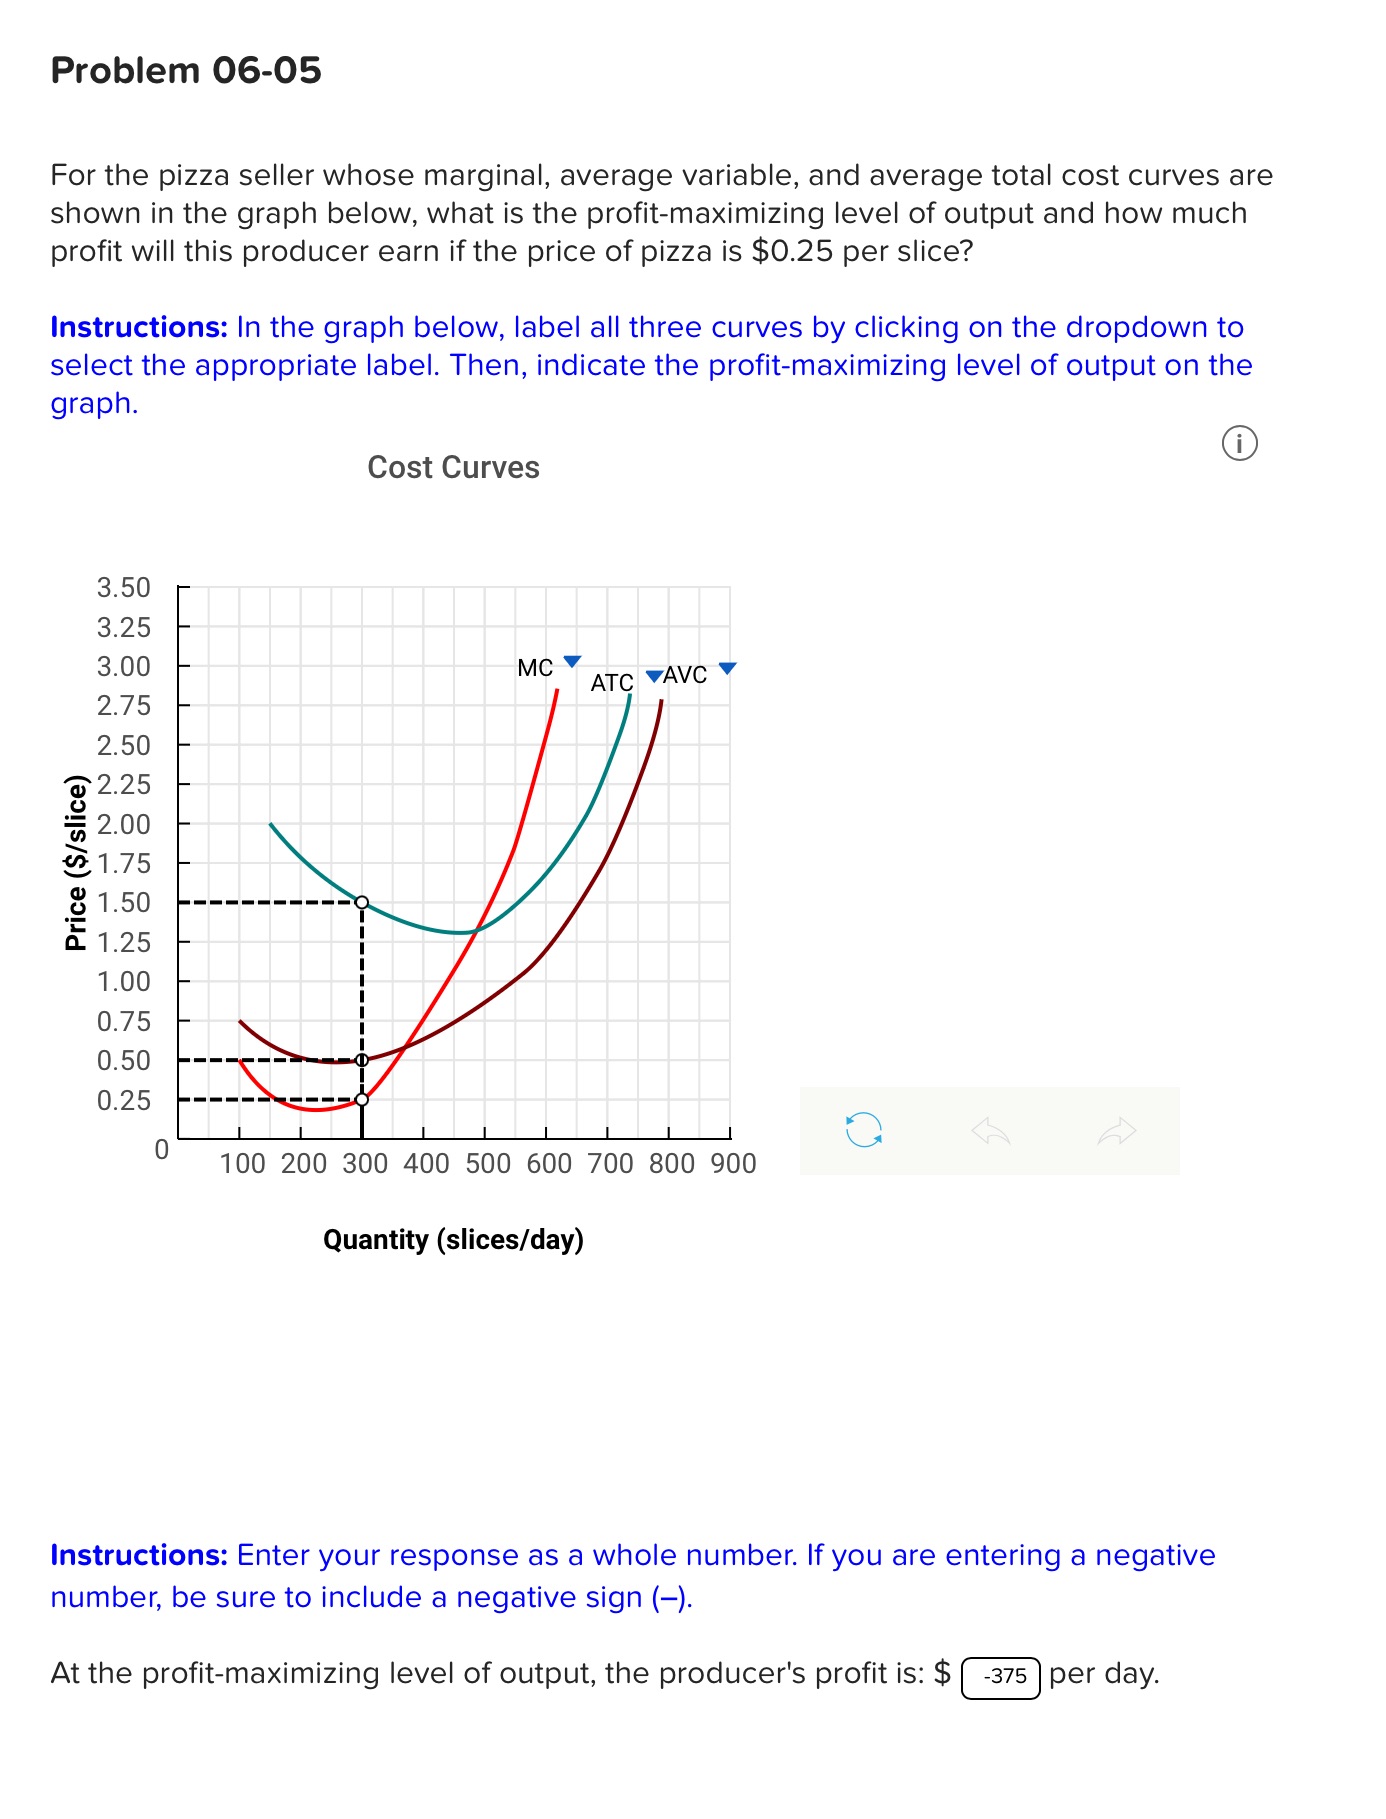

Problem 06-05 For the pizza seller whose marginal, average variable, and average total cost curves are shown in the graph below, what is the profit-maximizing level of output and how much profit will this producer earn if the price of pizza is $0.25 per slice? Instructions: In the graph below, label all three curves by clicking on the dropdown to select the appropriate label. Then, indicate the profit-maximizing level of output on the graph. Cost Curves 3.50 3.25 3.00 2.75 2.50
Step by Step Solution
There are 3 Steps involved in it
1 Expert Approved Answer
Step: 1 Unlock

Question Has Been Solved by an Expert!
Get step-by-step solutions from verified subject matter experts
Step: 2 Unlock
Step: 3 Unlock