

Question: Problem 1. (10 pts.)The following table contains data on the fat content ( in grams) vs the calories for 18 candy products. A scatter plot
Problem 1. (10 pts.)The following table contains data on the fat content ( in grams) vs the calories for 18 candy products. A scatter plot and a graph of the least squares fit are on the second page.
A.Determine the Pearson correlation coefficient for this data set. (on excel) =CORREL(B2:B19,C2:C19)=0.96
B.Determine the R squared value (on excel) =RSQ(C2:C19,B2:B19)=0.93
C.Determine the best linear fit to the data.
D.Use the best linear fit to estimate the number of calories in a candy bar with 20 grams of fat.
E.Is this a reasonable estimate? Explain you answer.
F.If you are on a diet, which are the two best and two worst candy bars for your diet.
G.Should we use this data to predict the number of calories in a zero fat candy bar.
H.Ignoring diet, which candy bar do you think is the best? (This is just a personal choice.)
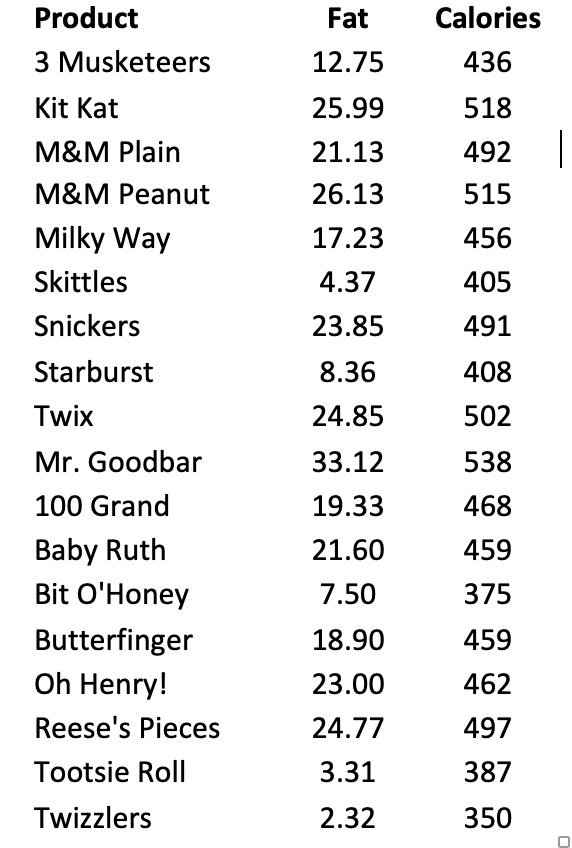
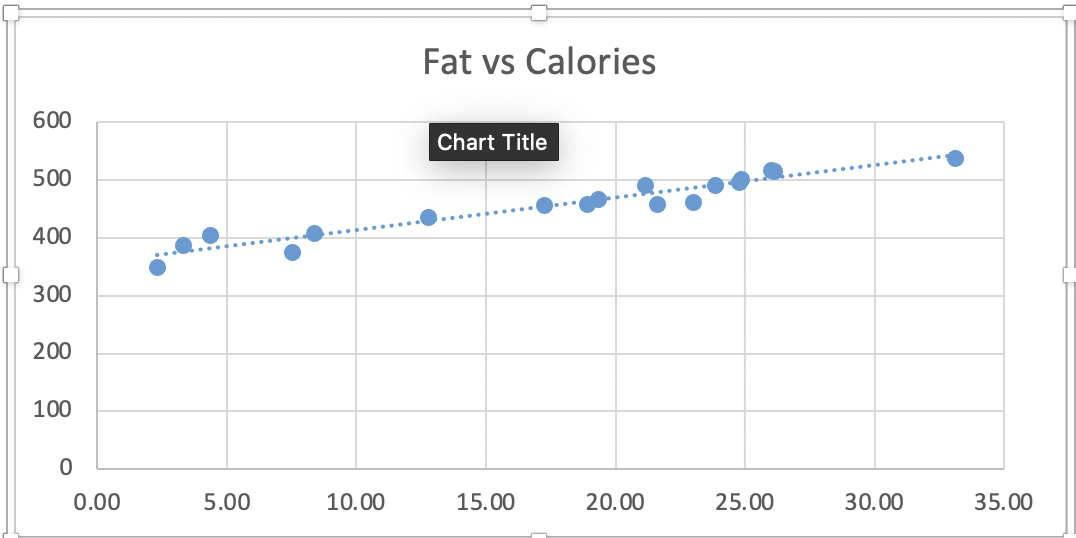
Product Fat Calories 3 Musketeers 12.75 436 Kit Kat 25.99 518 M&M Plain 21.13 492 M&M Peanut 26.13 515 Milky Way 17.23 456 Skittles 4.37 405 Snickers 23.85 491 Starburst 8.36 408 Twix 24.85 502 Mr. Goodbar 33.12 538 100 Grand 19.33 468 Baby Ruth 21.60 459 Bit O'Honey 7.50 375 Butterfinger 18.90 459 Oh Henry! 23.00 462 Reese's Pieces 24.77 497 Tootsie Roll 3.31 387 Twizzlers 2.32 350Fat vs Calories 600 Chart Title 500 .................. .......... 400 300 200 100 0 0.00 5.00 10.00 15.00 20.00 25.00 30.00 35.00
Step by Step Solution
There are 3 Steps involved in it

Get step-by-step solutions from verified subject matter experts