

Question: Problem 1 (12 marks in total). The following table depicts the results of a survey on consumption habits in a certain region. The tableau
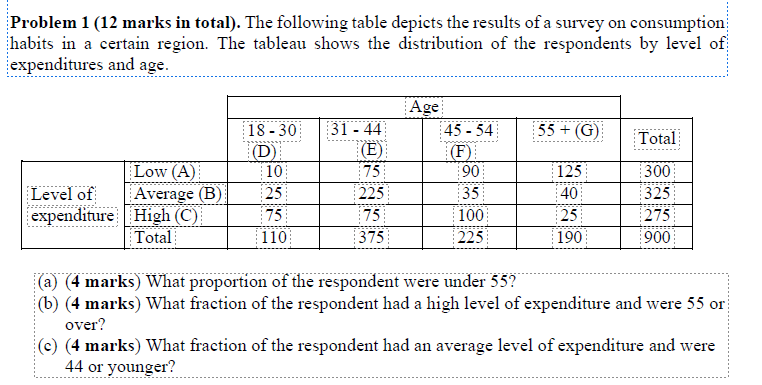
Problem 1 (12 marks in total). The following table depicts the results of a survey on consumption habits in a certain region. The tableau shows the distribution of the respondents by level of expenditures and age. Age 18-30 31 44 45-54 55+ (G) Total (D) (E) (F) Low (A) 10 75 90 125 300 Level of Average (B) 25 225 35 40 325 expenditure High (C) 75 75 100 25 275 Total 110 375 225 190 900 (a) (4 marks) What proportion of the respondent were under 55? (b) (4 marks) What fraction of the respondent had a high level of expenditure and were 55 or over? (c) (4 marks) What fraction of the respondent had an average level of expenditure and were 44 or younger?
Step by Step Solution
There are 3 Steps involved in it

Get step-by-step solutions from verified subject matter experts