

Question: Problem 1 ( 2 0 points ) Each year the Smalltown branch o f a furniture store sells 3 0 , 0 0 0 dining
Problem points
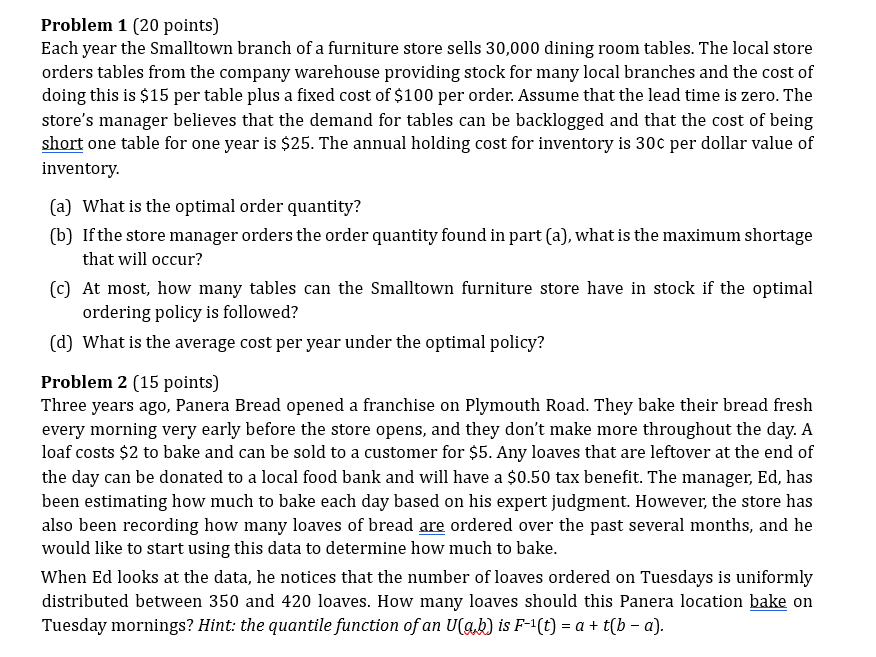
Each year the Smalltown branch a furniture store sells dining room tables. The local store orders tables from the company warehouse providing stock for many local branches and the cost doing this per table plus a fixed cost per order. Assume that the lead time zero. The store's manager believes that the demand for tables can backlogged and that the cost being short one table for one year The annual holding cost for inventory per dollar value inventory.
What the optimal order quantity?
the store manager orders the order quantity found part what the maximum shortage that will occur?
most, how many tables can the Smalltown furniture store have stock the optimal ordering policy followed?
What the average cost per year under the optimal policy?
Problem points
Three years ago, Panera Bread opened a franchise Plymouth Road. They bake their bread fresh every morning very early before the store opens, and they don't make more throughout the day. A loaf costs bake and can sold a customer for Any loaves that are leftover the end the day can donated a local food bank and will have tax benefit. The manager, has been estimating how much bake each day based his expert judgment. However, the store has also been recording how many loaves bread are ordered over the past several months, and would like start using this data determine how much bake.
When looks the data, notices that the number loaves ordered Tuesdays uniformly distributed between and loaves. How many loaves should this Panera location bake Tuesday mornings? Hint: the quantile function
Problem points
Formulate the following problem a linear program and solve using the Excel Solver. Repport the
optimal solution and profit.
You're working Industrial Engineer Dell. Customers purchase laptops throughout the year,
but before each semester, university bookstores order large quantities have stock for students
and staff. The business intelligence unit just released the initial demand forecasts for January orders
the Midwest region, and your manager, Alejandro, stopped your office discuss the production
plans. He'd like know the most profitable way fill all the orders and asked you send him
report next Thursday. wants a breakdown how many units each type laptop the
manufacturing division should plan produce. Because it's a draft plan, Alejandro fine with non
integer estimates.
They have the option produce one four types the product line. There are two sizes:
and and both have a touchscreen and nontouchscreen option. The prices the non
touchscreen laptops are $ and $ for and respectively, and the price the
touchscreen option either size additional $ The production costs the laptop are
$touchscreen and $ and the laptop costs $touch and $
The forecast predicts a total units ordered. says will for laptops,
will for laptops, and the remaining units won't have a size specified. They predict
exactly touchscreens will ordered but can't say what size. Space may also a
factor Dell has set aside cubic feet storage space for these orders. The boxes for the
laptops take cubic feet, and the boxes for the laptops take cubic feet.
Problem points
Consider the following linear programming formulation:
min,
Graph all constraints and clearly identify the feasible region for the solution. Make sure
clearly label which line the graph corresponds each constraint.
Solve the using the graphical method called the isoprofit line method and the corner
point method and state the optimal solution and the optimal objective function
value.
Which constraints are binding the optimal solution?
Consider removing the constraint from the problem. Does doing this change the feasible
region? Explain why why not.
Step by Step Solution
There are 3 Steps involved in it
1 Expert Approved Answer
Step: 1 Unlock

Question Has Been Solved by an Expert!
Get step-by-step solutions from verified subject matter experts
Step: 2 Unlock
Step: 3 Unlock