

Question: Problem 1 ( 2 0 pts ) Demand data for the first six time periods in a year are shown in Table 1 below. The
Problem pts
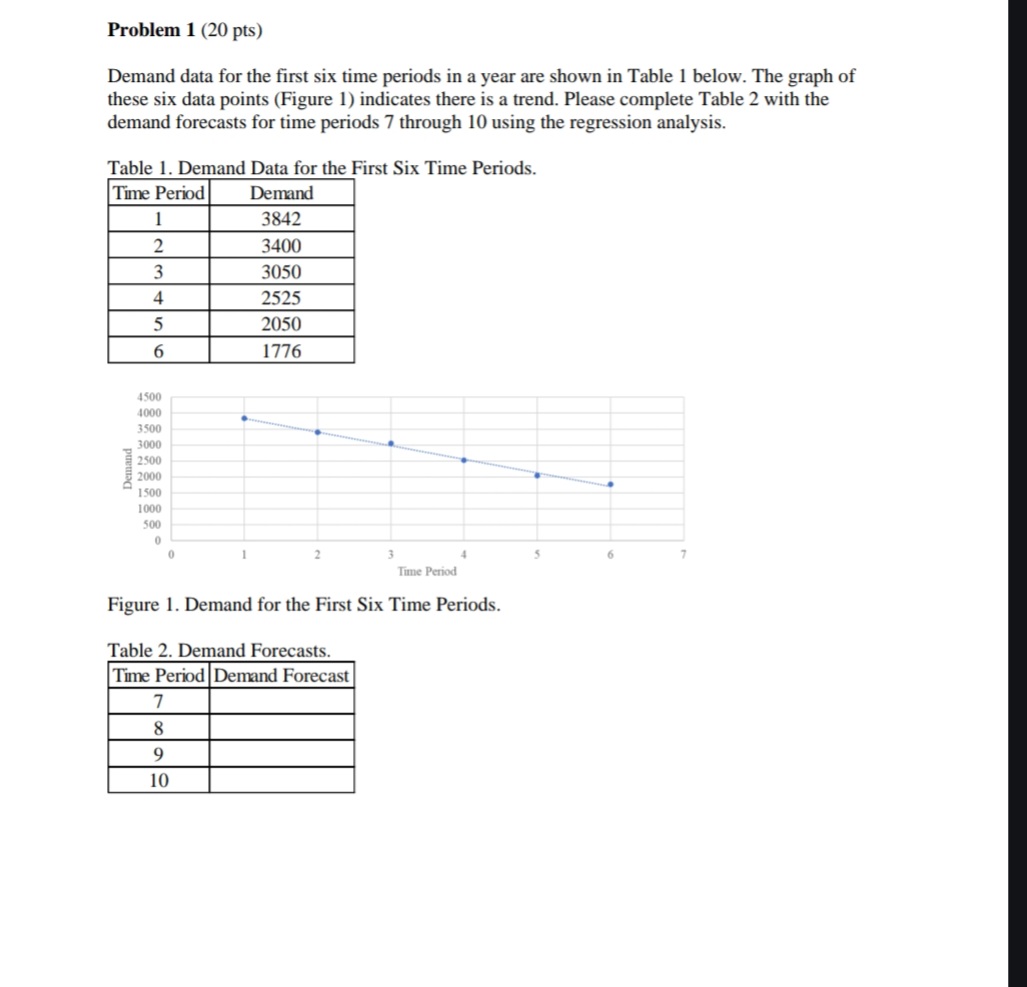
Demand data for the first six time periods in a year are shown in Table below. The graph of
these six data points Figure indicates there is a trend. Please complete Table with the
demand forecasts for time periods through using the regression analysis.
Table Demand Data for the First Six Time Periods.
Figure Demand for the First Six Time Periods.
Table Demand Forecasts.
Step by Step Solution
There are 3 Steps involved in it
1 Expert Approved Answer
Step: 1 Unlock

Question Has Been Solved by an Expert!
Get step-by-step solutions from verified subject matter experts
Step: 2 Unlock
Step: 3 Unlock