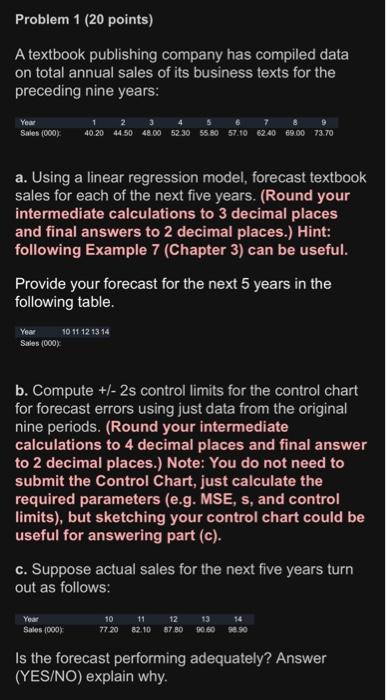
Question: Problem 1 (20 points) A textbook publishing company has compiled data on total annual sales of its business texts for the preceding nine years: Yowsiles(000)140.20244.50348.00452.30555.50657.10762.40869.00973.70

Problem 1 (20 points) A textbook publishing
Problem 1 (20 points) A textbook publishing company has compiled data on total annual sales of its business texts for the preceding nine years: Yowsiles(000)140.20244.50348.00452.30555.50657.10762.40869.00973.70 a. Using a linear regression model, forecast textbook sales for each of the next five years. (Round your intermediate calculations to 3 decimal places and final answers to 2 decimal places.) Hint: following Example 7 (Chapter 3 ) can be useful. Provide your forecast for the next 5 years in the following table. Year Sales (000) b. Compute +/2s control limits for the control chart for forecast errors using just data from the original nine periods. (Round your intermediate calculations to 4 decimal places and final answer to 2 decimal places.) Note: You do not need to submit the Control Chart, just calculate the required parameters (e.g. MSE, s, and control limits), but sketching your control chart could be useful for answering part (c). c. Suppose actual sales for the next five years turn out as follows: Is the forecast performing adequately? Answer (YES/NO) explain why. Problem 1 (20 points) A textbook publishing company has compiled data on total annual sales of its business texts for the preceding nine years: Yowsiles(000)140.20244.50348.00452.30555.50657.10762.40869.00973.70 a. Using a linear regression model, forecast textbook sales for each of the next five years. (Round your intermediate calculations to 3 decimal places and final answers to 2 decimal places.) Hint: following Example 7 (Chapter 3 ) can be useful. Provide your forecast for the next 5 years in the following table. Year Sales (000) b. Compute +/2s control limits for the control chart for forecast errors using just data from the original nine periods. (Round your intermediate calculations to 4 decimal places and final answer to 2 decimal places.) Note: You do not need to submit the Control Chart, just calculate the required parameters (e.g. MSE, s, and control limits), but sketching your control chart could be useful for answering part (c). c. Suppose actual sales for the next five years turn out as follows: Is the forecast performing adequately? Answer (YES/NO) explain why

Step by Step Solution

There are 3 Steps involved in it

1 Expert Approved Answer
Step: 1 Unlock blur-text-image
Question Has Been Solved by an Expert!

Get step-by-step solutions from verified subject matter experts

Step: 2 Unlock
Step: 3 Unlock

Students Have Also Explored These Related General Management Questions!