

Question: Problem 1 (20 points) Answer all questions below. Make sure to show your work whenever appropriate. The grades on a statistics exam are as follows:
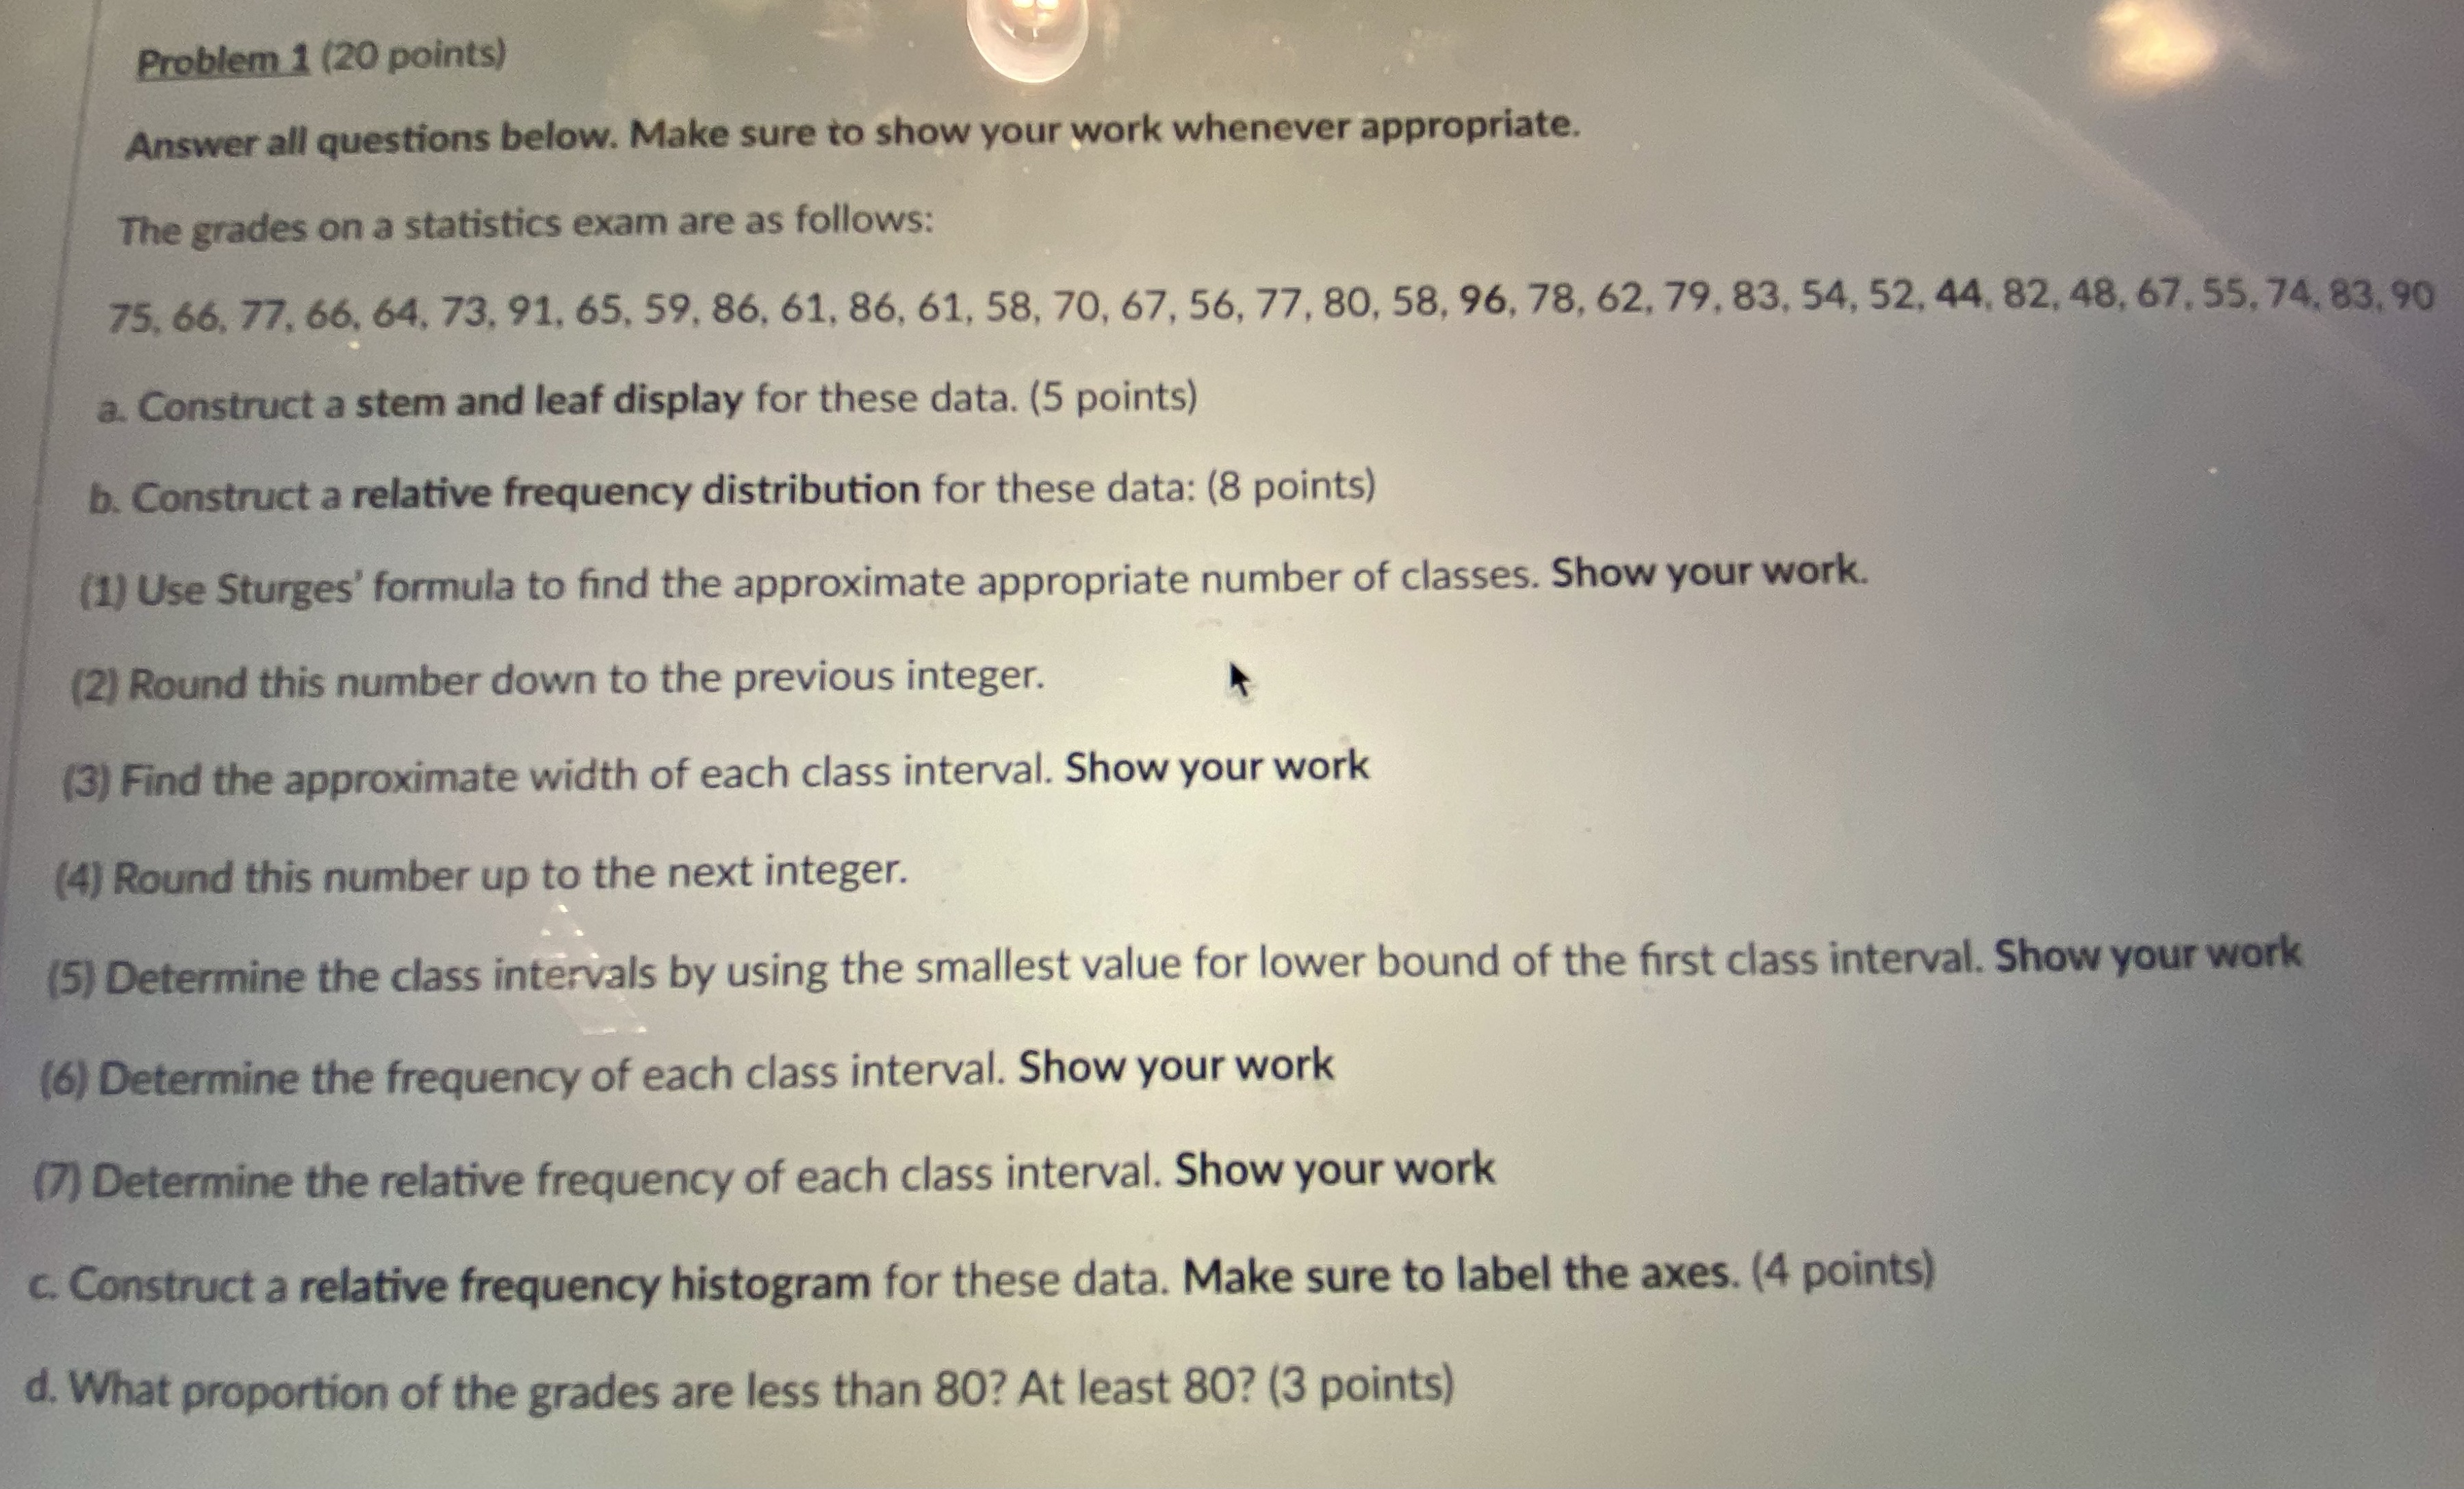
Problem 1 (20 points) Answer all questions below. Make sure to show your work whenever appropriate. The grades on a statistics exam are as follows: 75, 66, 77, 66, 64, 73, 91, 65, 59, 86, 61, 86, 61, 58, 70, 67, 56, 77, 80, 58, 96, 78, 62, 79, 83, 54, 52, 44. 82, 48, 67. 55, 74, 83, 90 a. Construct a stem and leaf display for these data. (5 points) b. Construct a relative frequency distribution for these data: (8 points) (1) Use Sturges' formula to find the approximate appropriate number of classes. Show your work. (2) Round this number down to the previous integer. (3) Find the approximate width of each class interval. Show your work (4) Round this number up to the next integer. (5) Determine the class intervals by using the smallest value for lower bound of the first class interval. Show your work (6) Determine the frequency of each class interval. Show your work (7) Determine the relative frequency of each class interval. Show your work c. Construct a relative frequency histogram for these data. Make sure to label the axes. (4 points) d. What proportion of the grades are less than 80? At least 80? (3 points)
Step by Step Solution
There are 3 Steps involved in it

Get step-by-step solutions from verified subject matter experts