

Question: Problem 1 (20 points) When potential workers apply for a job that requires extensive manual assembly of small intricate parts, they are initially given three
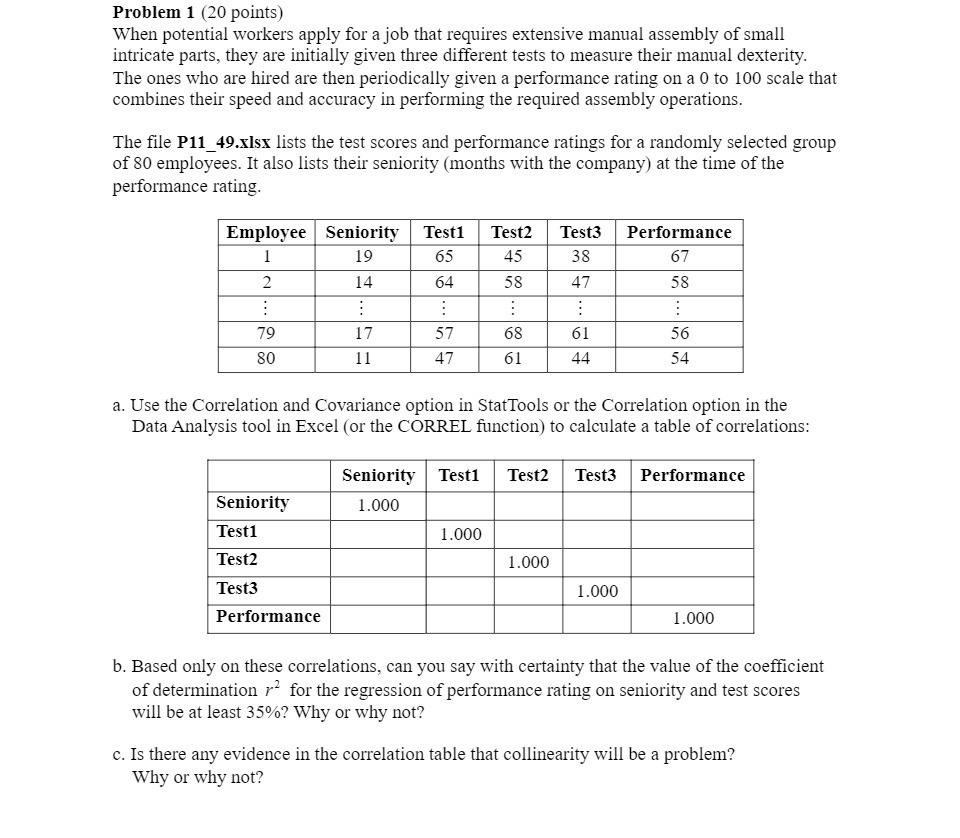
Problem 1 (20 points) When potential workers apply for a job that requires extensive manual assembly of small intricate parts, they are initially given three different tests to measure their manual dexterity. The ones who are hired are then periodically given a performance rating on a 0 to 100 scale that combines their speed and accuracy in performing the required assembly operations. The file P11_49.xIsx lists the test scores and performance ratings for a randomly selected group of 80 employees. It also lists their seniority (months with the company) at the time of the performance rating. Employee Seniority Test1 Test2 Test3 Performance 19 65 45 38 67 2 14 64 58 47 58 . . . 79 17 57 68 61 56 80 11 47 61 44 54 a. Use the Correlation and Covariance option in StatTools or the Correlation option in the Data Analysis tool in Excel (or the CORREL function) to calculate a table of correlations: Seniority Test1 Test2 Test3 Performance Seniority 1.000 Test1 1.000 Test2 1.000 Test3 1.000 Performance 1.000 b. Based only on these correlations, can you say with certainty that the value of the coefficient of determination r for the regression of performance rating on seniority and test scores will be at least 35%? Why or why not? c. Is there any evidence in the correlation table that collinearity will be a problem? Why or why not
Step by Step Solution
There are 3 Steps involved in it

Get step-by-step solutions from verified subject matter experts