

Question: Problem 1 (20 pts) You study ligand binding to two proteins, A and B (aka macromolecules, M). You measured the concentration, [Mx), of the ligand-bound
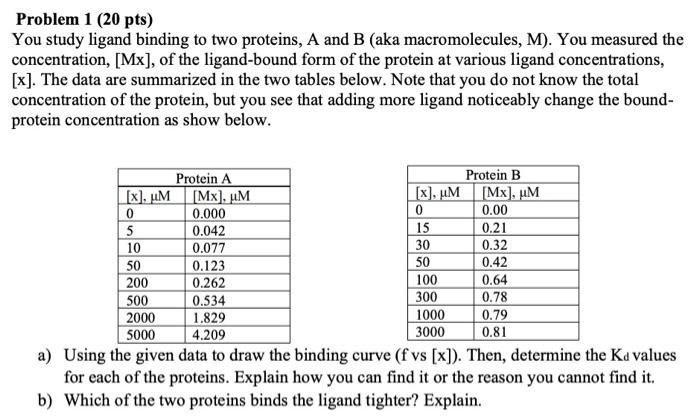
Problem 1 (20 pts) You study ligand binding to two proteins, A and B (aka macromolecules, M). You measured the concentration, [Mx), of the ligand-bound form of the protein at various ligand concentrations, [x]. The data are summarized in the two tables below. Note that you do not know the total concentration of the protein, but you see that adding more ligand noticeably change the bound- protein concentration as show below. Protein A Protein B [x], uM [Mx], uM [x), uM Mx), uM 0 0.000 0 0.00 5 0.042 15 0.21 10 0.077 30 0.32 50 0.123 50 0.42 200 0.262 100 0.64 500 0.534 300 0.78 2000 1.829 1000 0.79 5000 4.209 3000 0.81 a) Using the given data to draw the binding curve (f vs [x]). Then, determine the Ka values for each of the proteins. Explain how you can find it or the reason you cannot find it. b) Which of the two proteins binds the ligand tighter? Explain
Step by Step Solution
There are 3 Steps involved in it

Get step-by-step solutions from verified subject matter experts