

Question: Problem 1 3 - 7 ( Algo ) Ten samples of 1 5 parts each were taken from an ongoing process to establish a p
Problem Algo
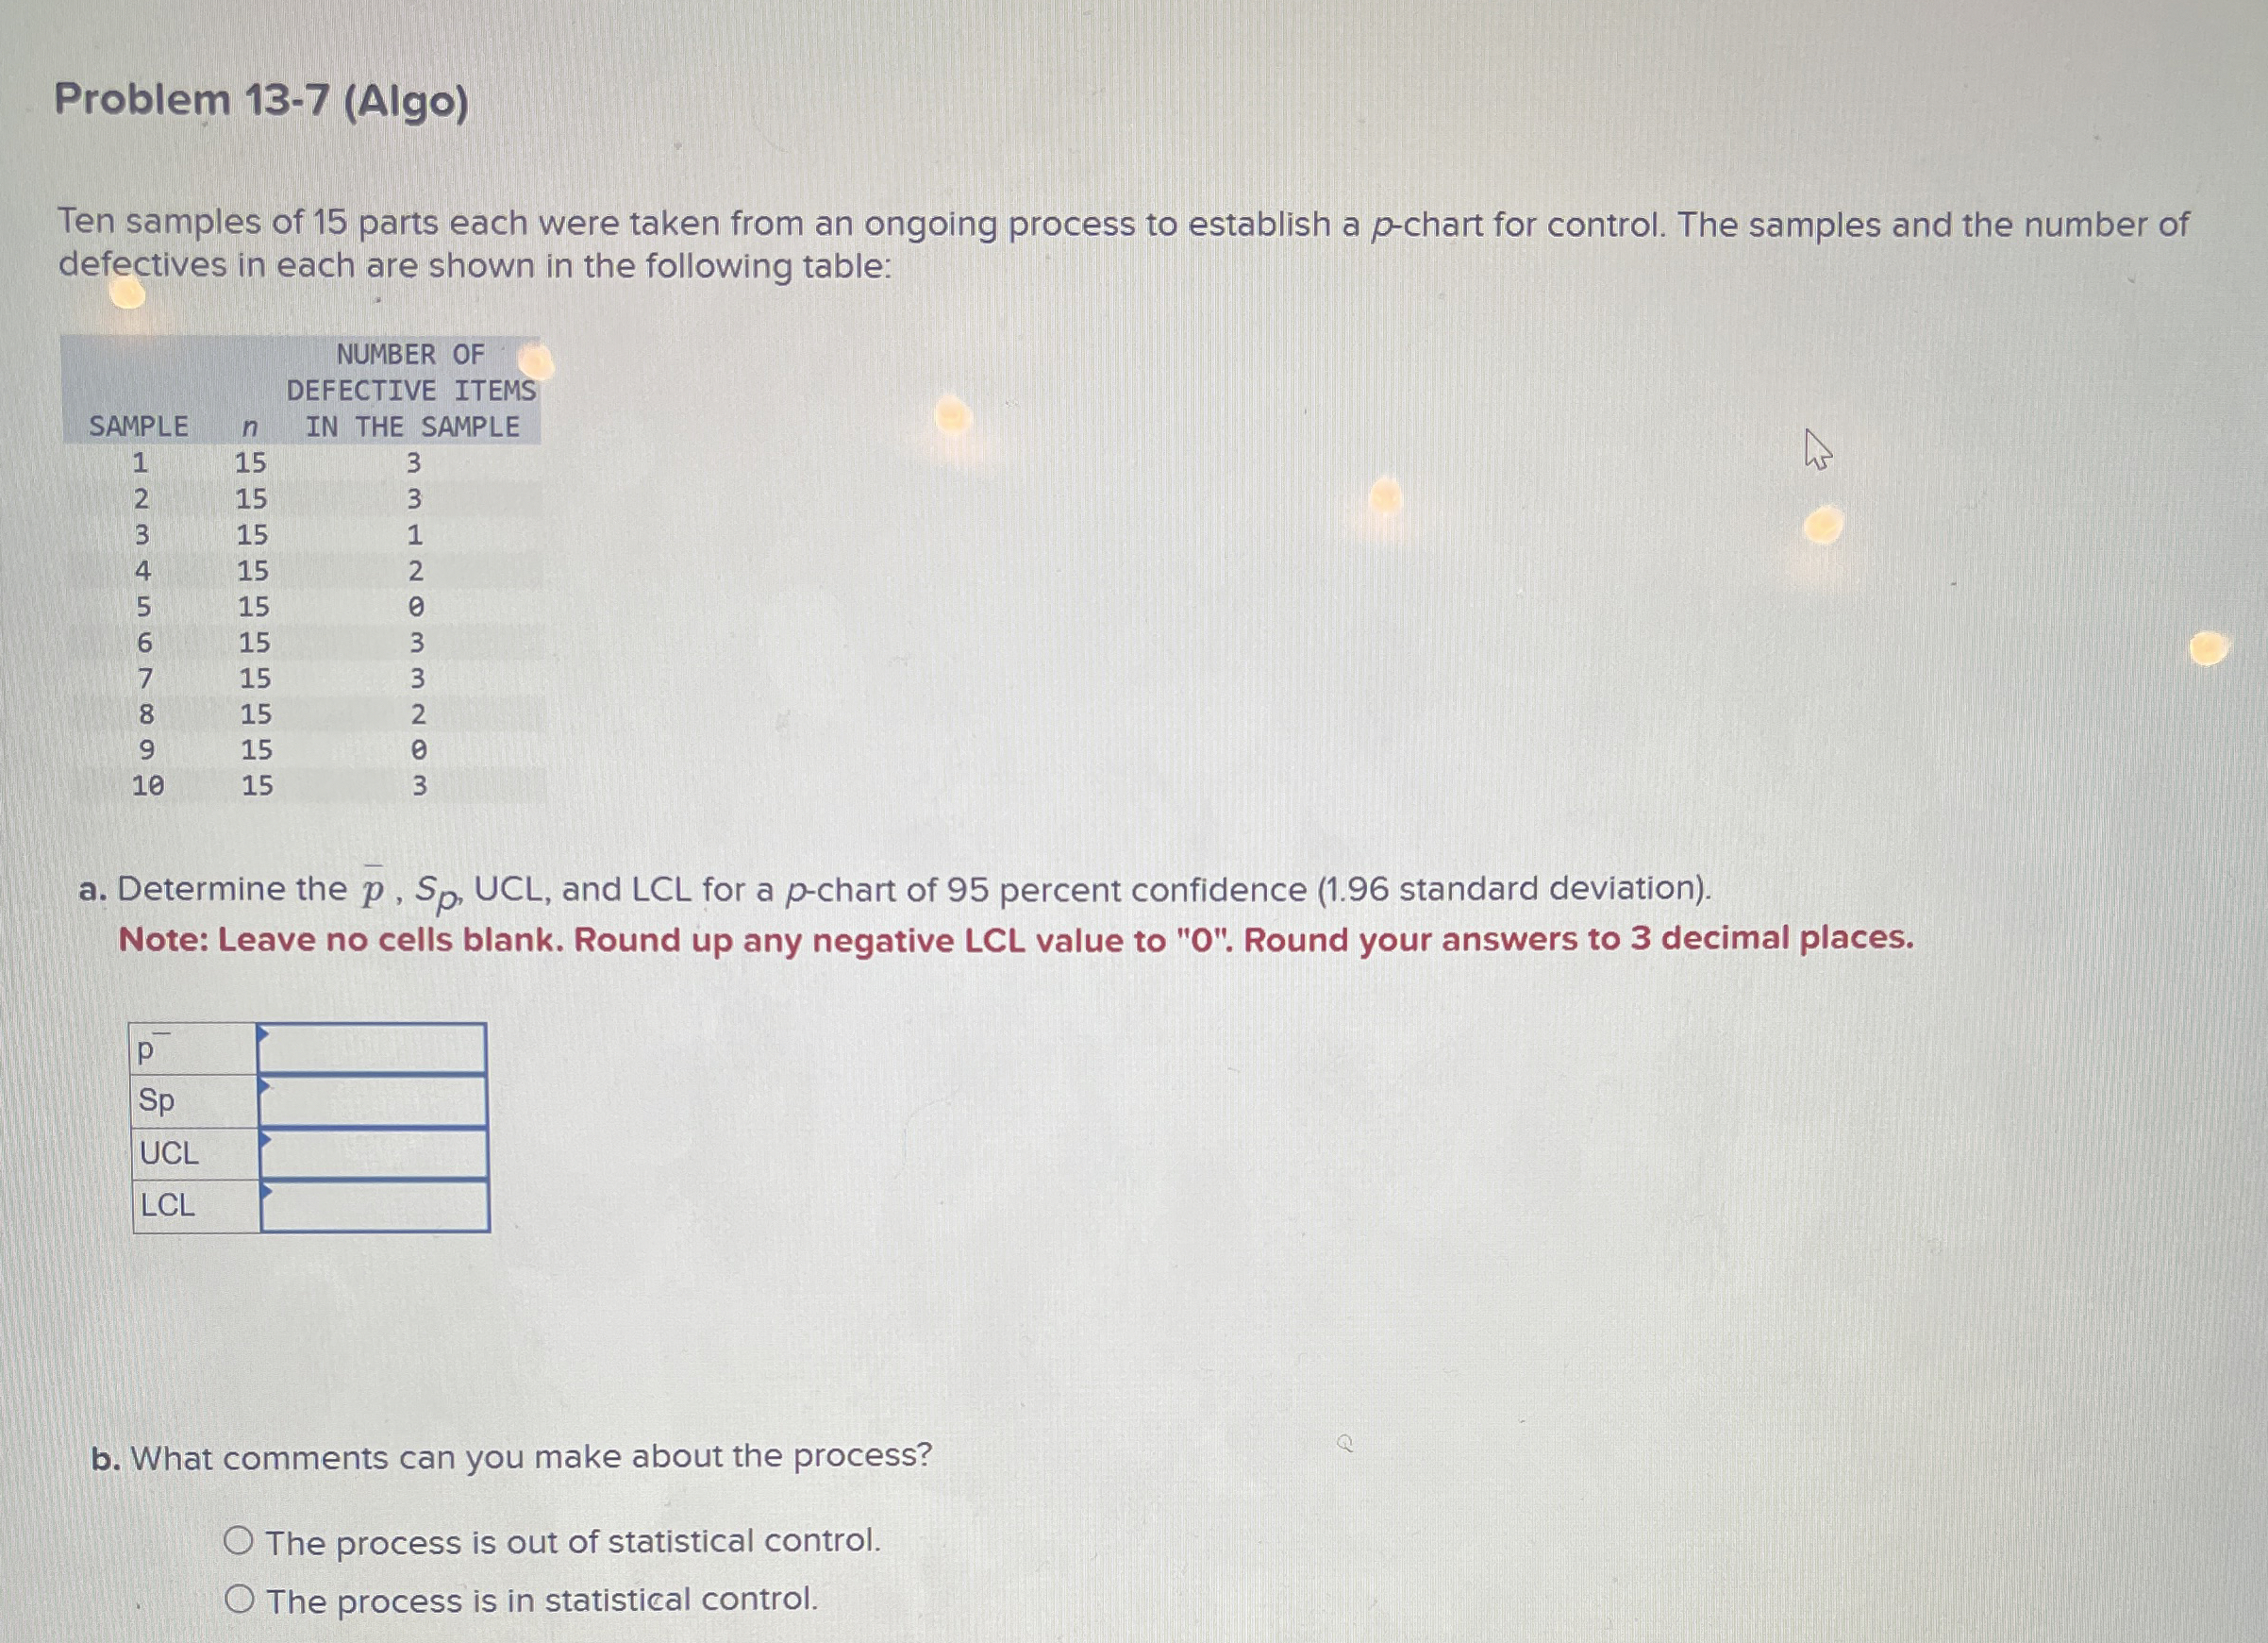
Ten samples of parts each were taken from an ongoing process to establish a pchart for control. The samples and the number of defectives in each are shown in the following table:
tabletableNUMBER OFDEFECTIVE ITEMSSAMPLEIN THE SAMPLE
a Determine the UCL, and LCL for a pchart of percent confidence standard deviation
Note: Leave no cells blank. Round up any negative LCL value to O Round your answers to decimal places.
tableSpUCLLCL
b What comments can you make about the process?
The process is out of statistical control.
The process is in statistical control.
Step by Step Solution
There are 3 Steps involved in it
1 Expert Approved Answer
Step: 1 Unlock

Question Has Been Solved by an Expert!
Get step-by-step solutions from verified subject matter experts
Step: 2 Unlock
Step: 3 Unlock