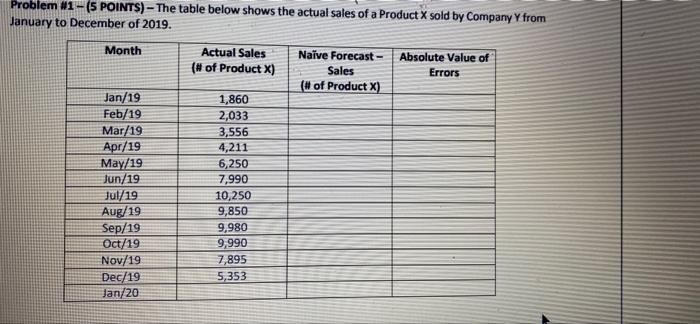
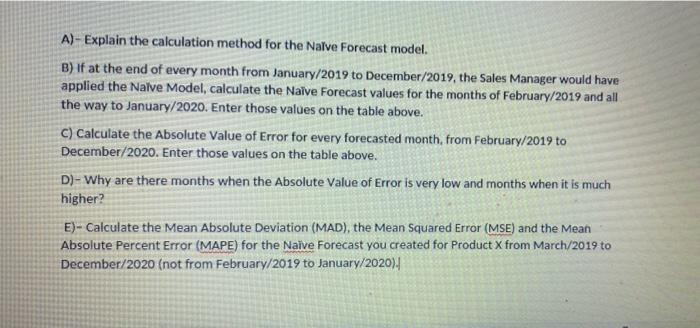
Question: Problem #1 - (5 POINTS) - The table below shows the actual sales of a Product X sold by Company Y from January to December

Problem #1 - (5 POINTS) - The table below shows
Problem #1 - (5 POINTS) - The table below shows the actual sales of a Product X sold by Company Y from January to December of 2019. Month Actual Sales Naive Forecast - Absolute Value of (# of Product x) Sales Errors (# of Product x) Jan/19 1,860 Feb/19 2,033 Mar/19 3,556 Apr/19 4,211 May/19 6,250 Jun/19 7,990 Jul/19 10,250 Aug/19 9,850 Sep/19 9,980 Oct/19 9,990 Nov/19 7,895 Dec/19 5,353 Jan/20 A)- Explain the calculation method for the Nalve Forecast model. B) If at the end of every month from January/2019 to December/2019, the Sales Manager would have applied the Nalve Model, calculate the Naive Forecast values for the months of February/2019 and all the way to January/2020. Enter those values on the table above. C) Calculate the Absolute Value of Error for every forecasted month, from February/2019 to December/2020. Enter those values on the table above. D)- Why are there months when the Absolute Value of Error is very low and months when it is much higher? E)- Calculate the Mean Absolute Deviation (MAD), the Mean Squared Error (MSE) and the Mean Absolute Percent Error (MAPE) for the Naive Forecast you created for product X from March/2019 to December/2020 (not from February/2019 to January/2020)

Step by Step Solution

There are 3 Steps involved in it

1 Expert Approved Answer
Step: 1 Unlock blur-text-image
Question Has Been Solved by an Expert!

Get step-by-step solutions from verified subject matter experts

Step: 2 Unlock
Step: 3 Unlock

Students Have Also Explored These Related General Management Questions!