

Question: Problem 1 - 50 points Refer to Chapter 7 - example 7-1 Use the load summary chart below to arrange departments 1 through 9 on
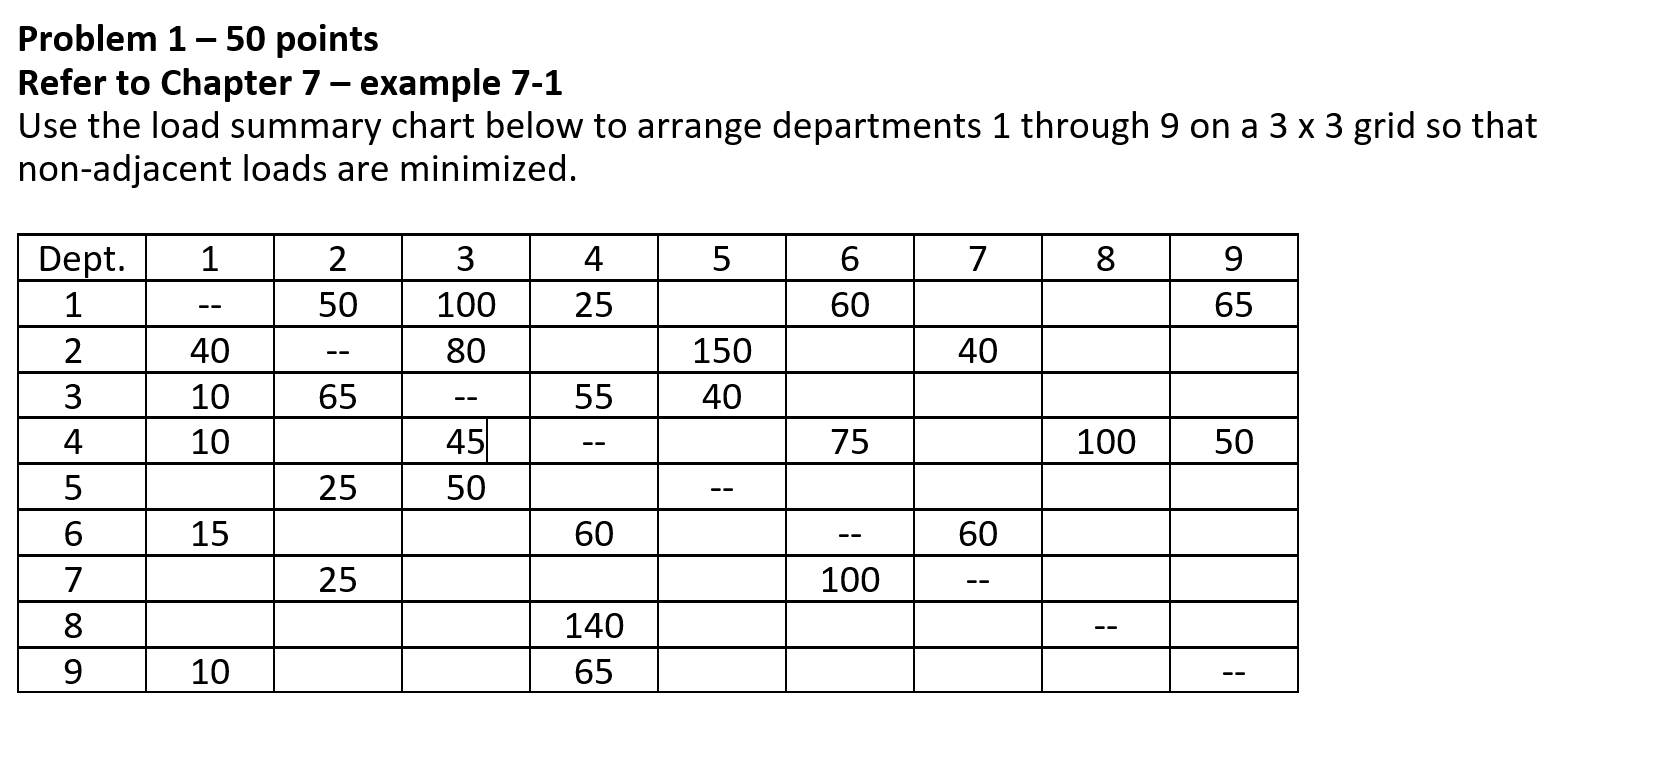
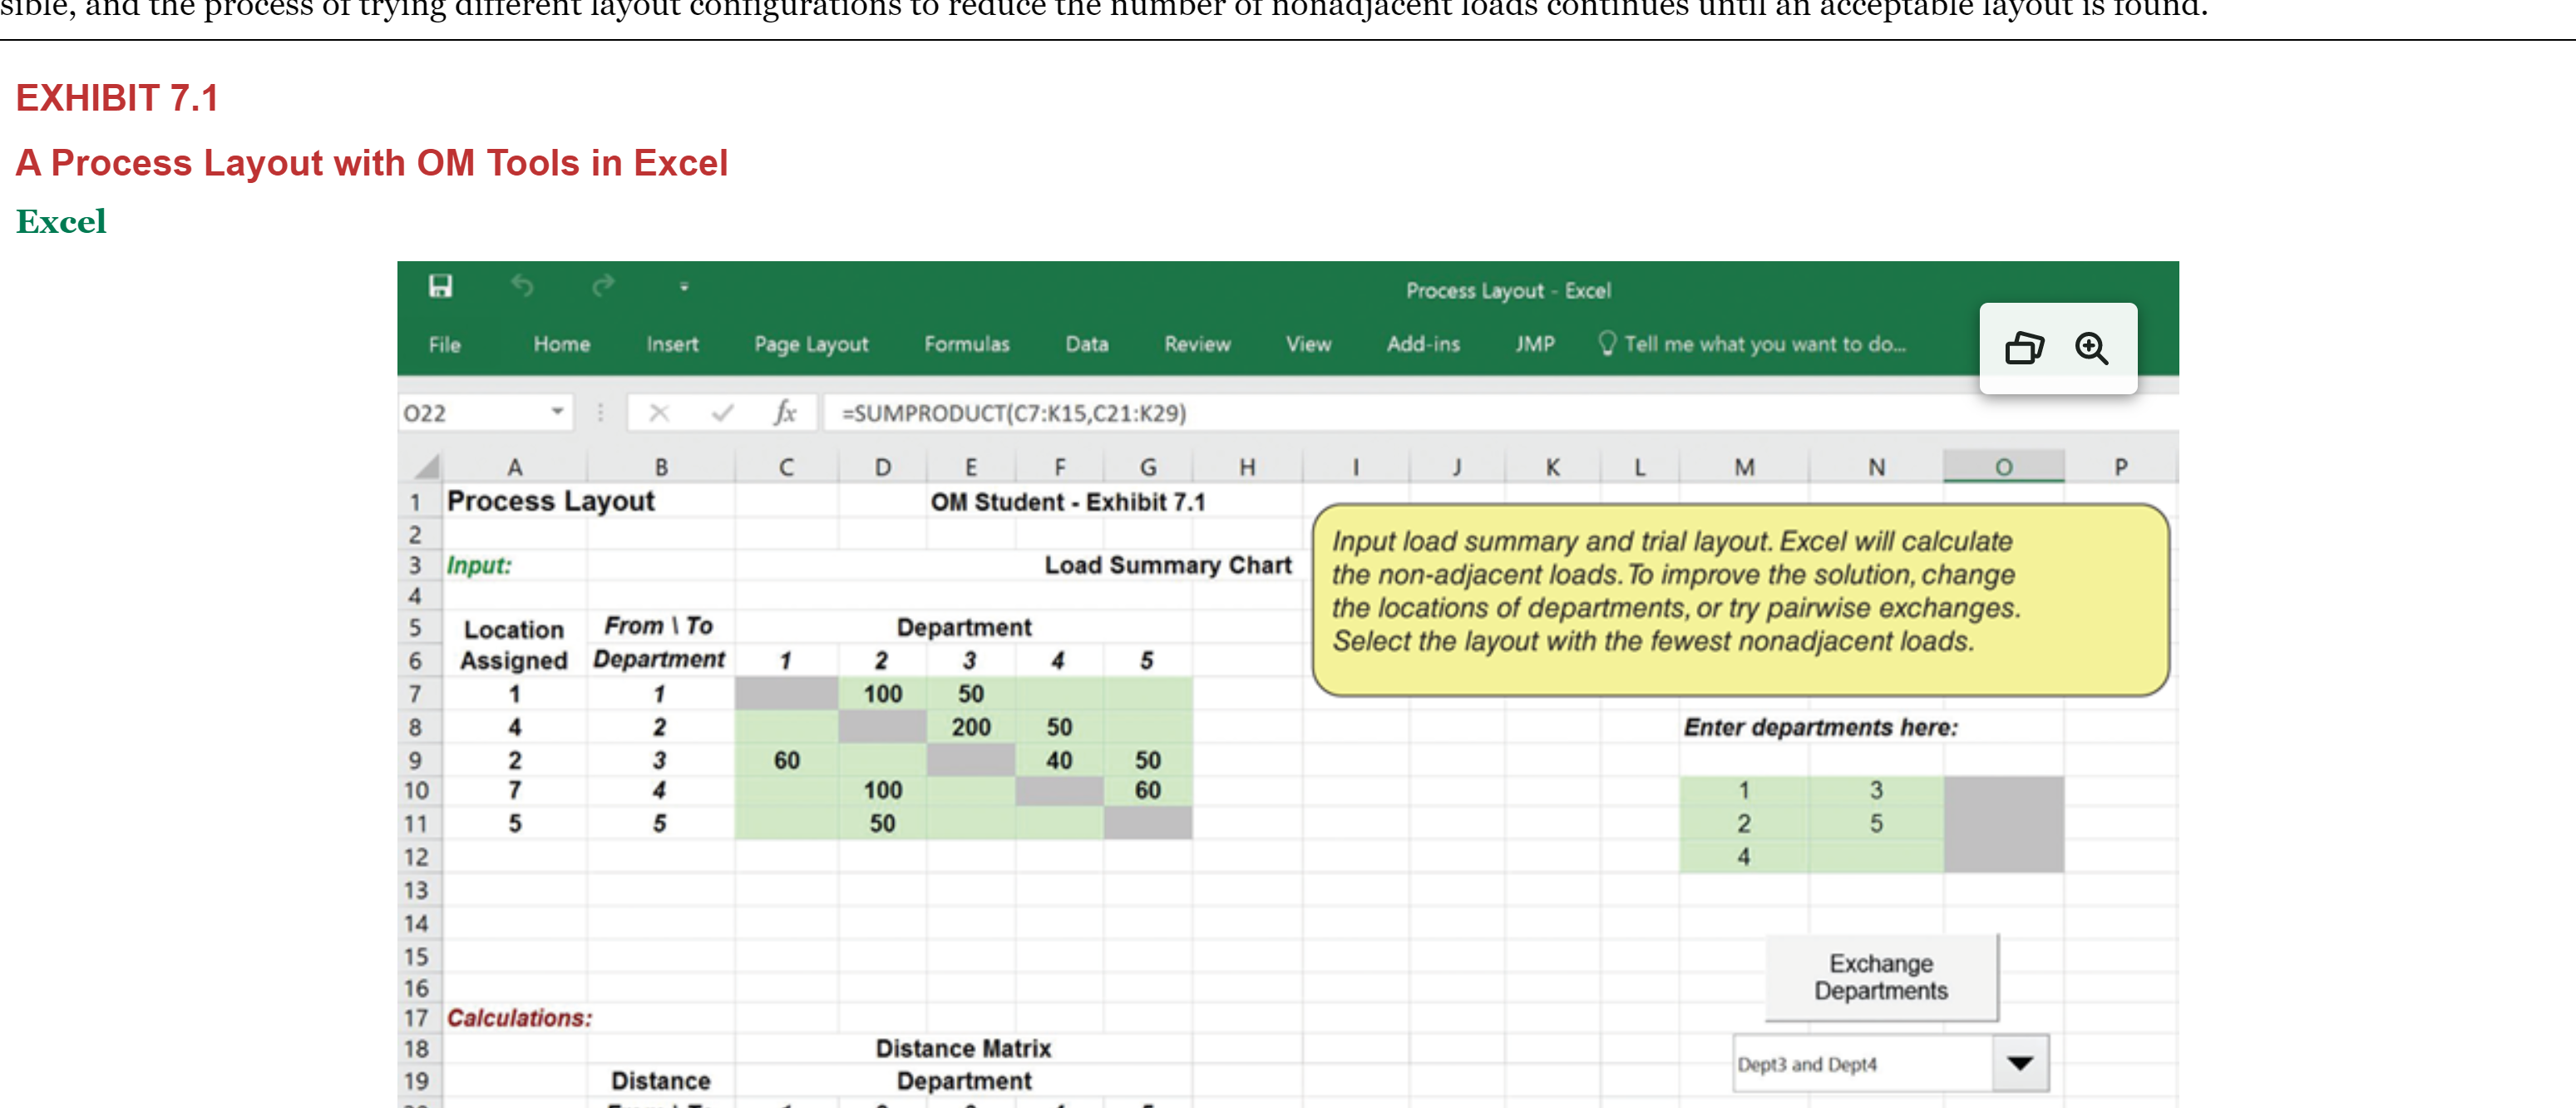
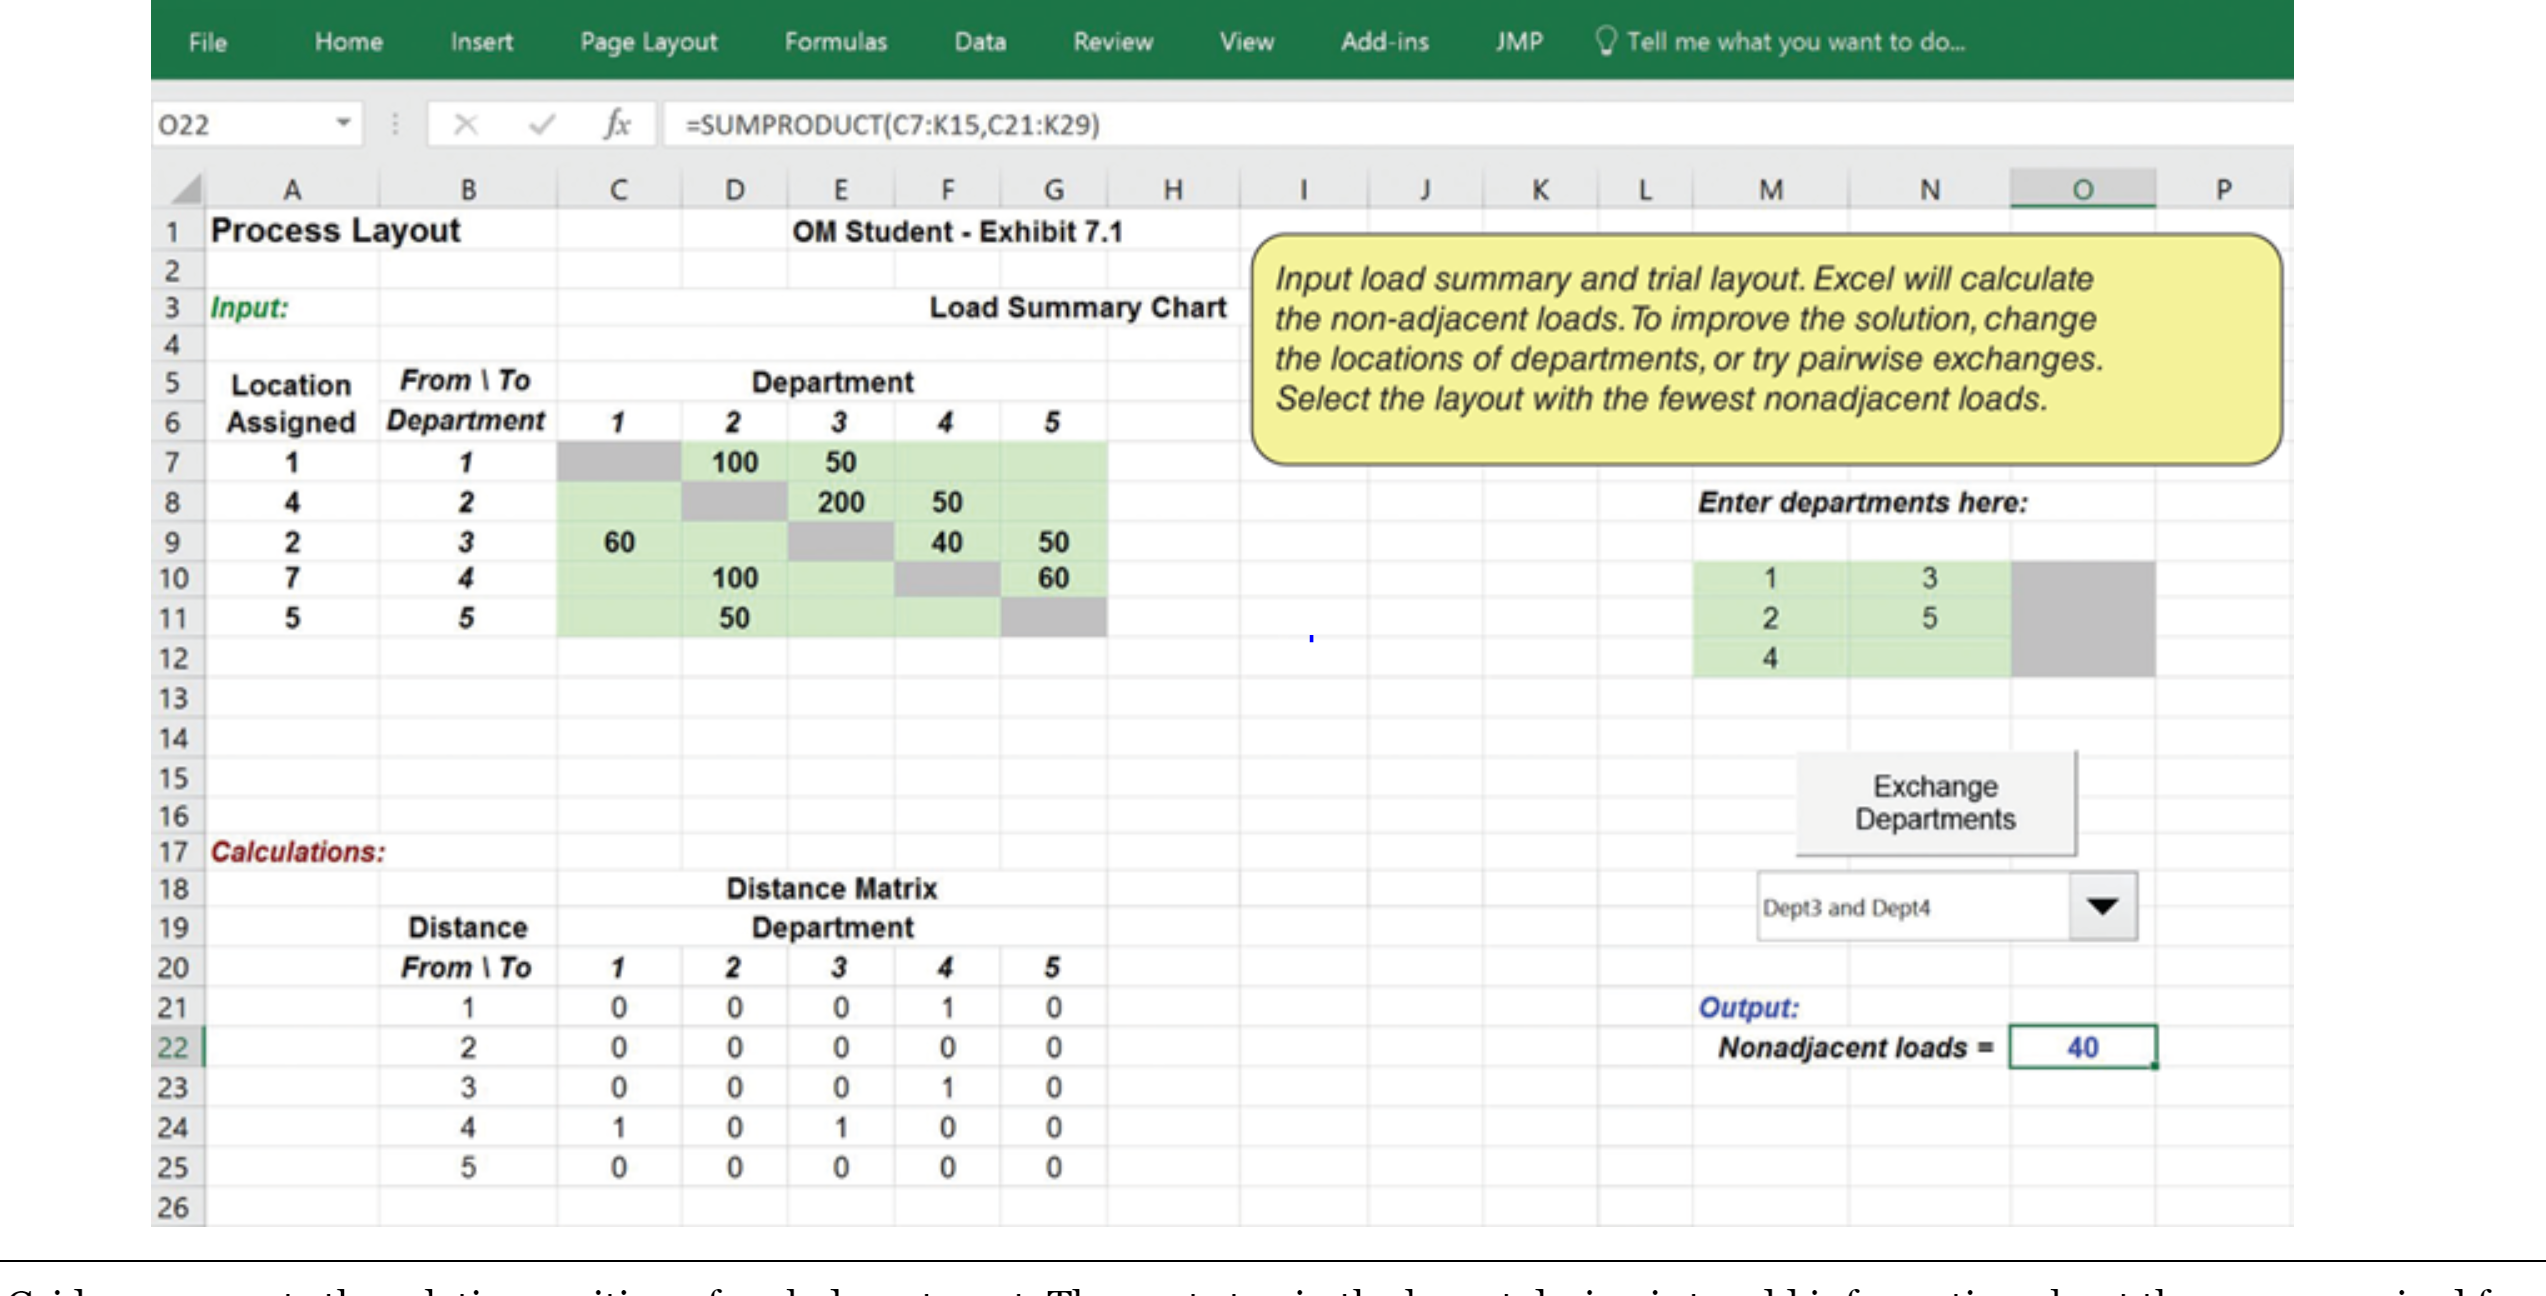
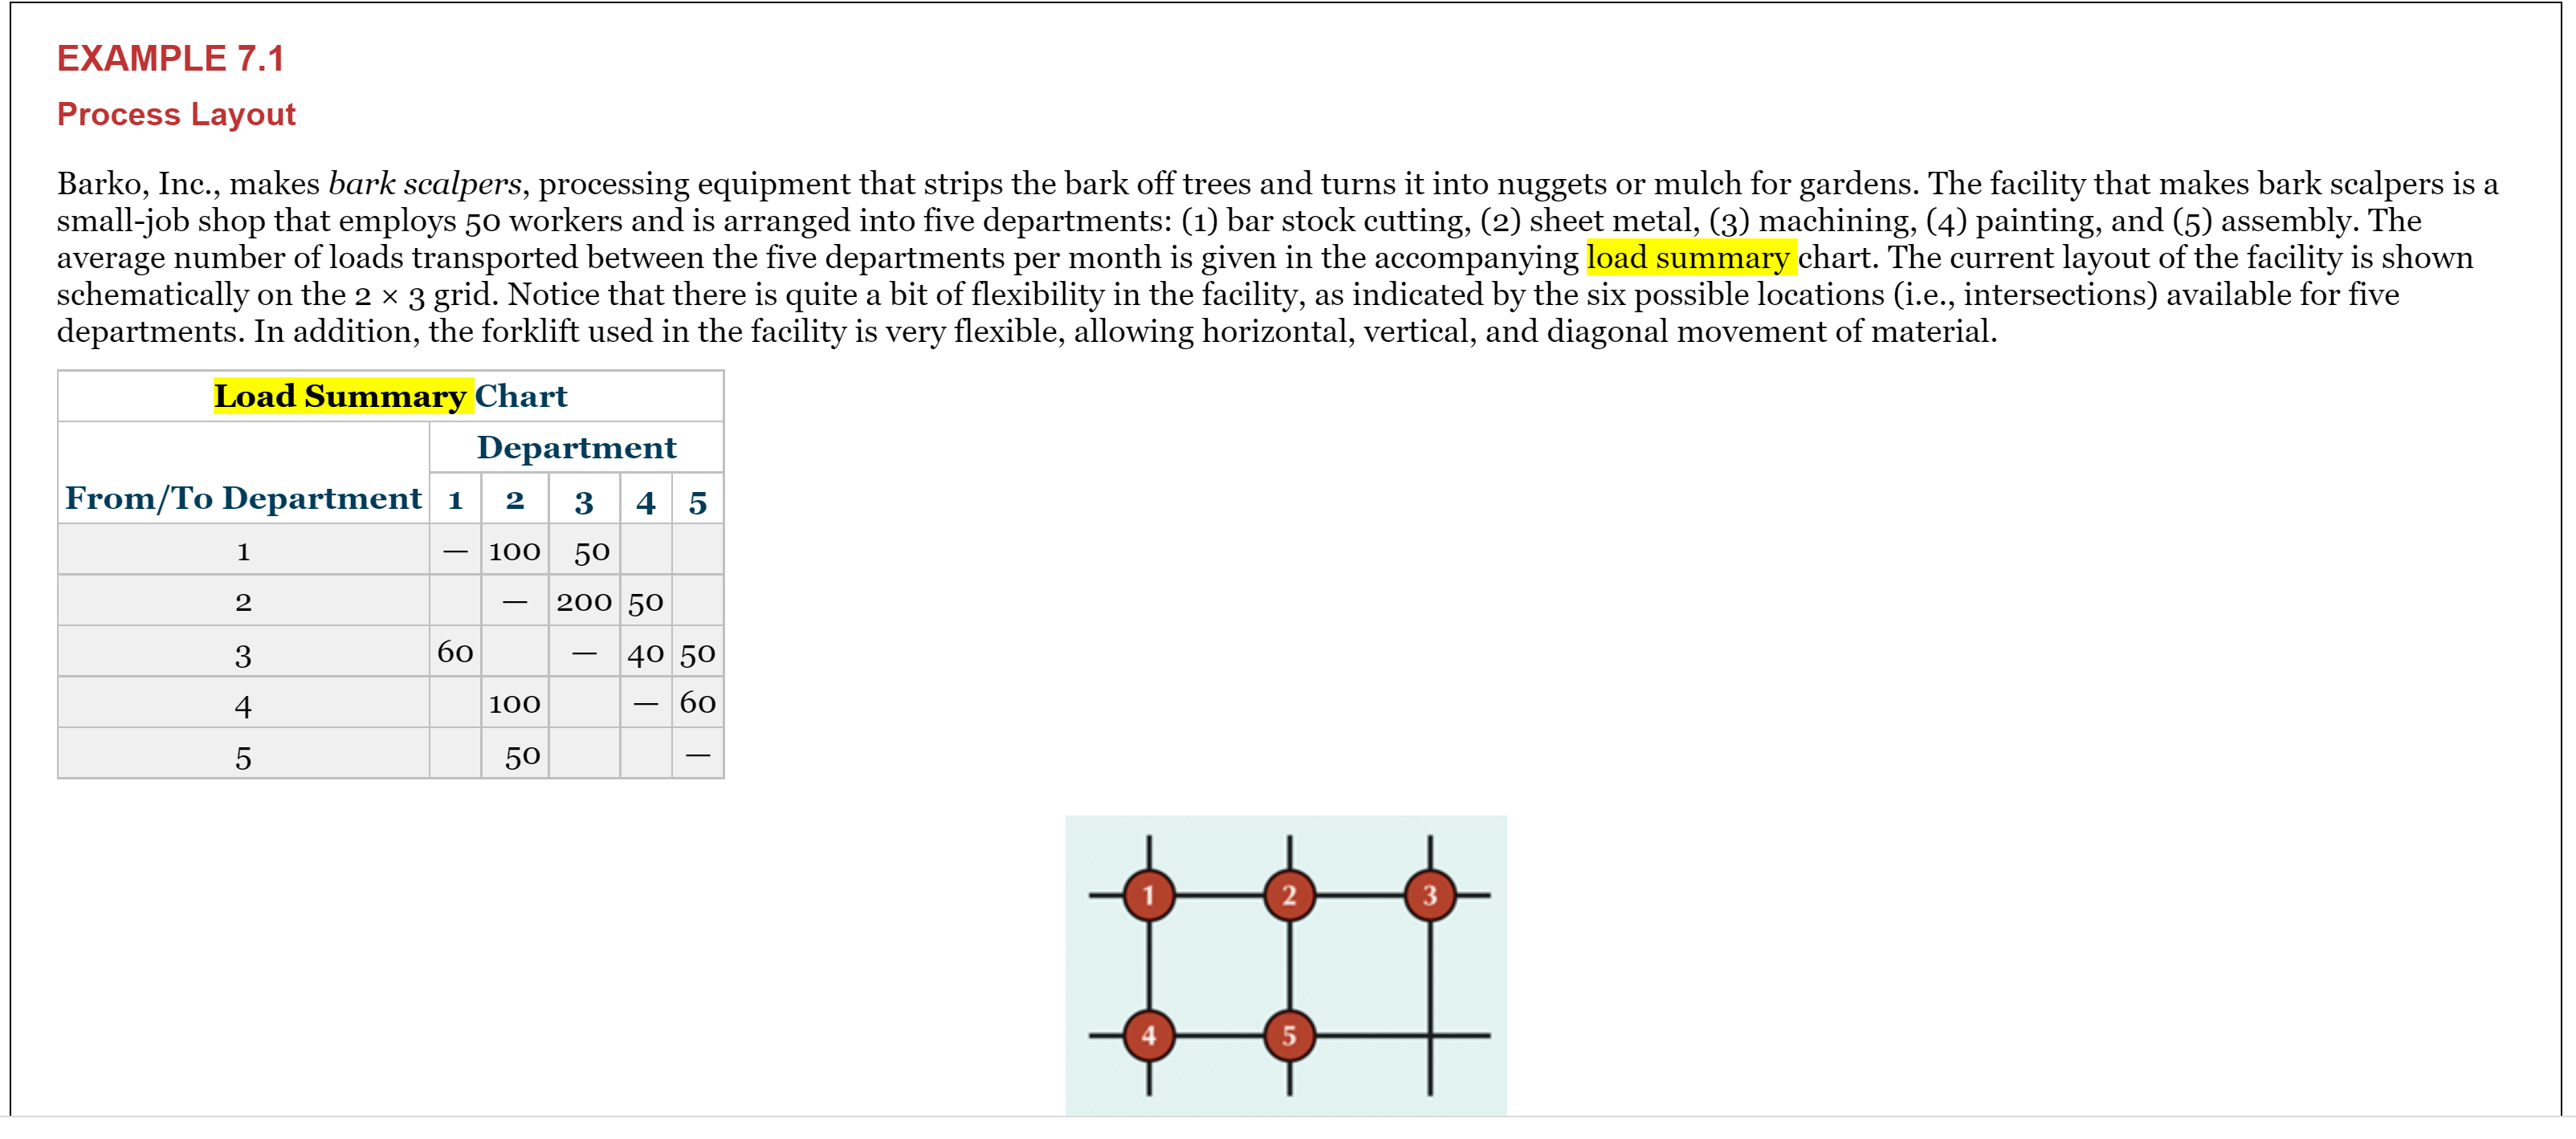
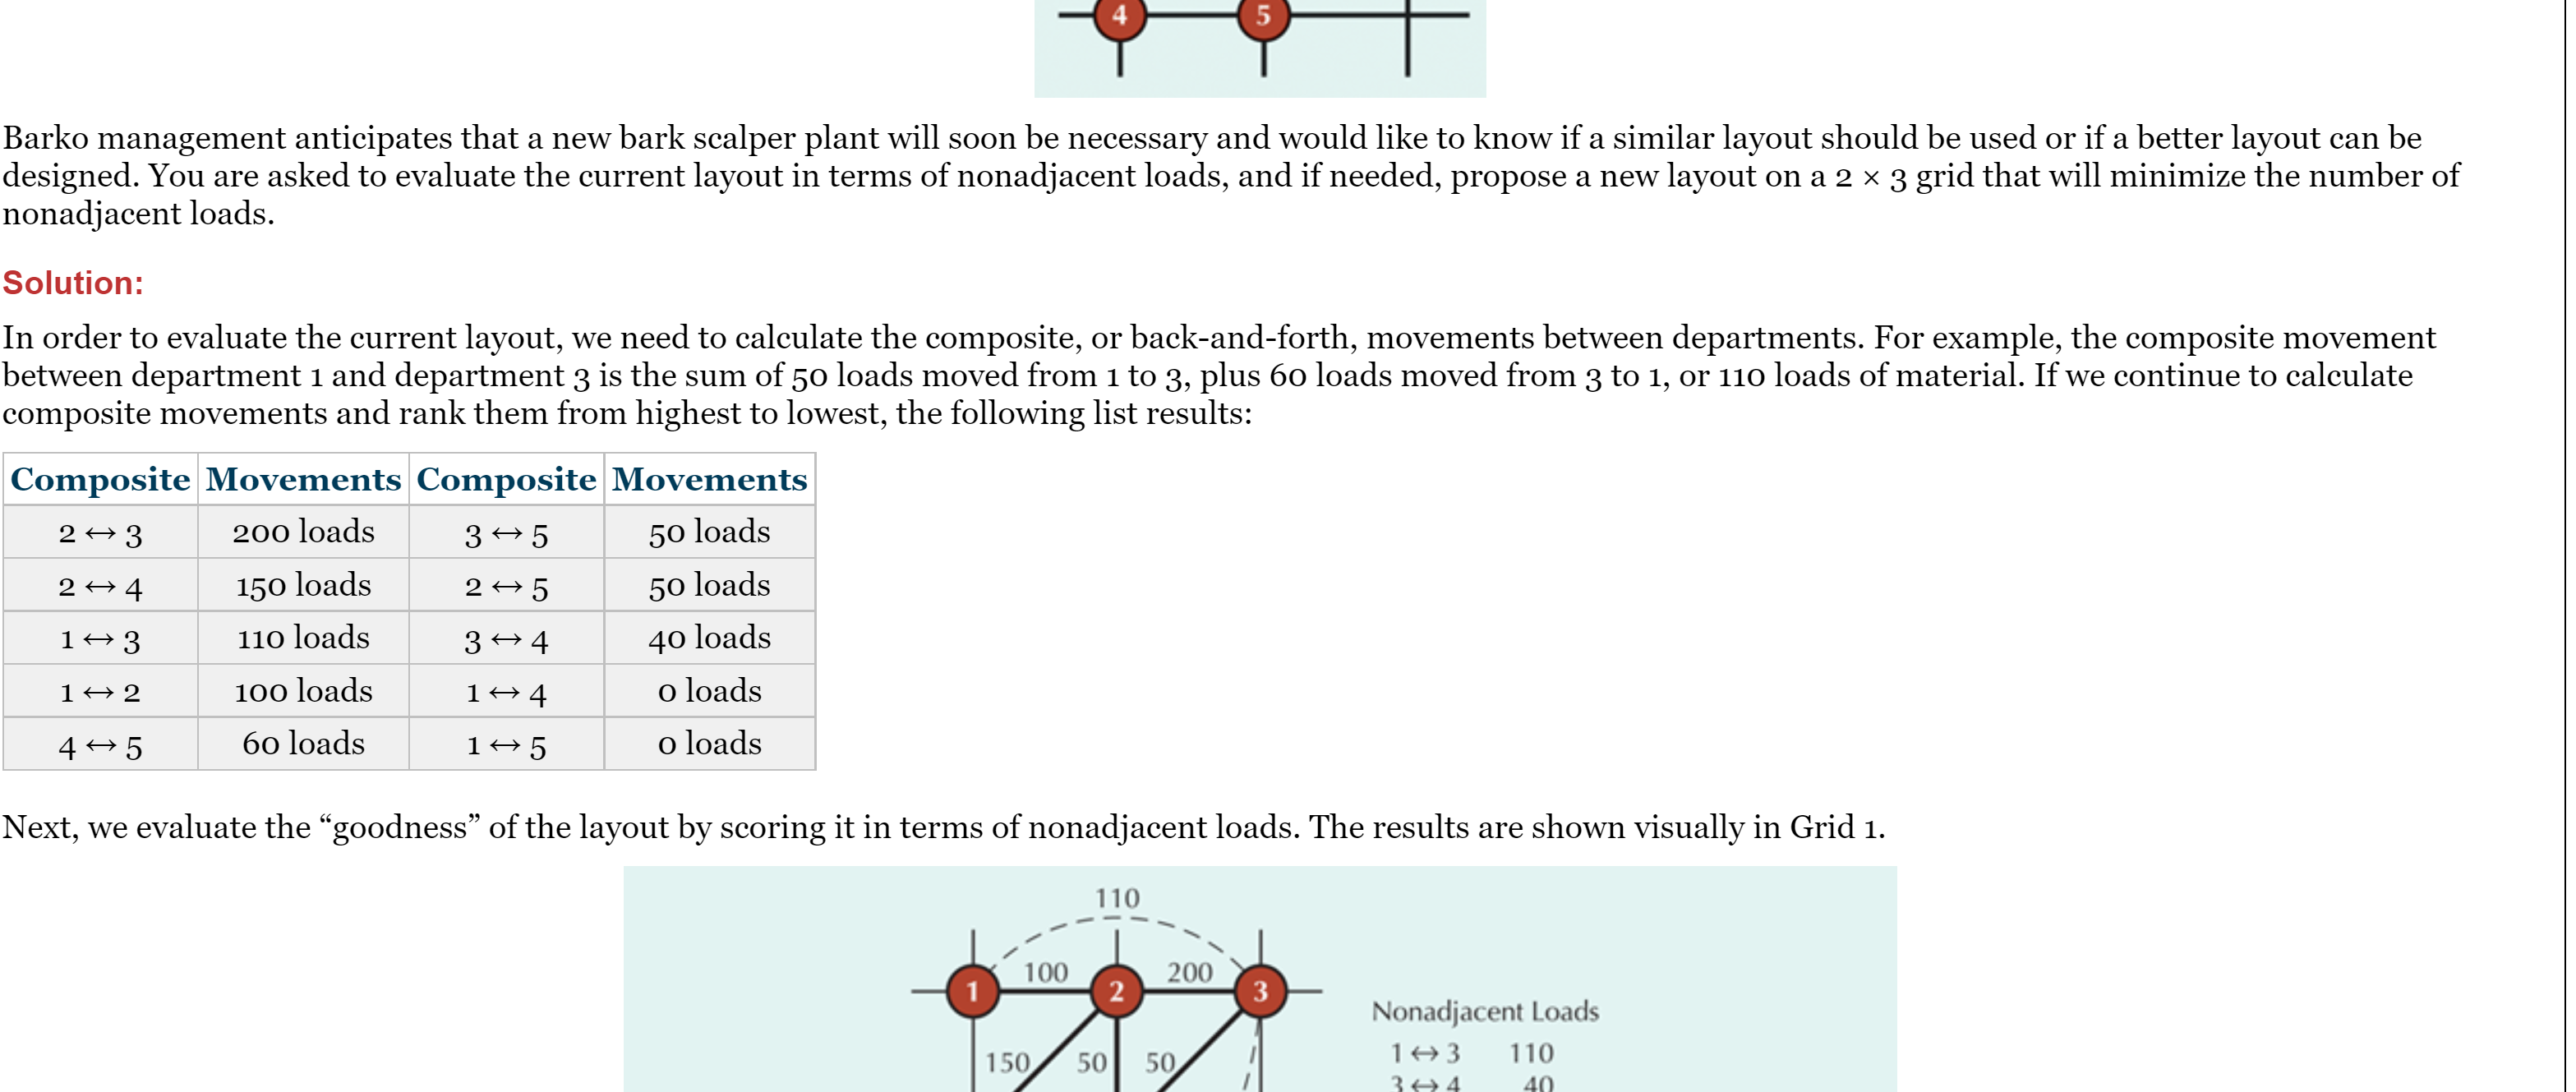
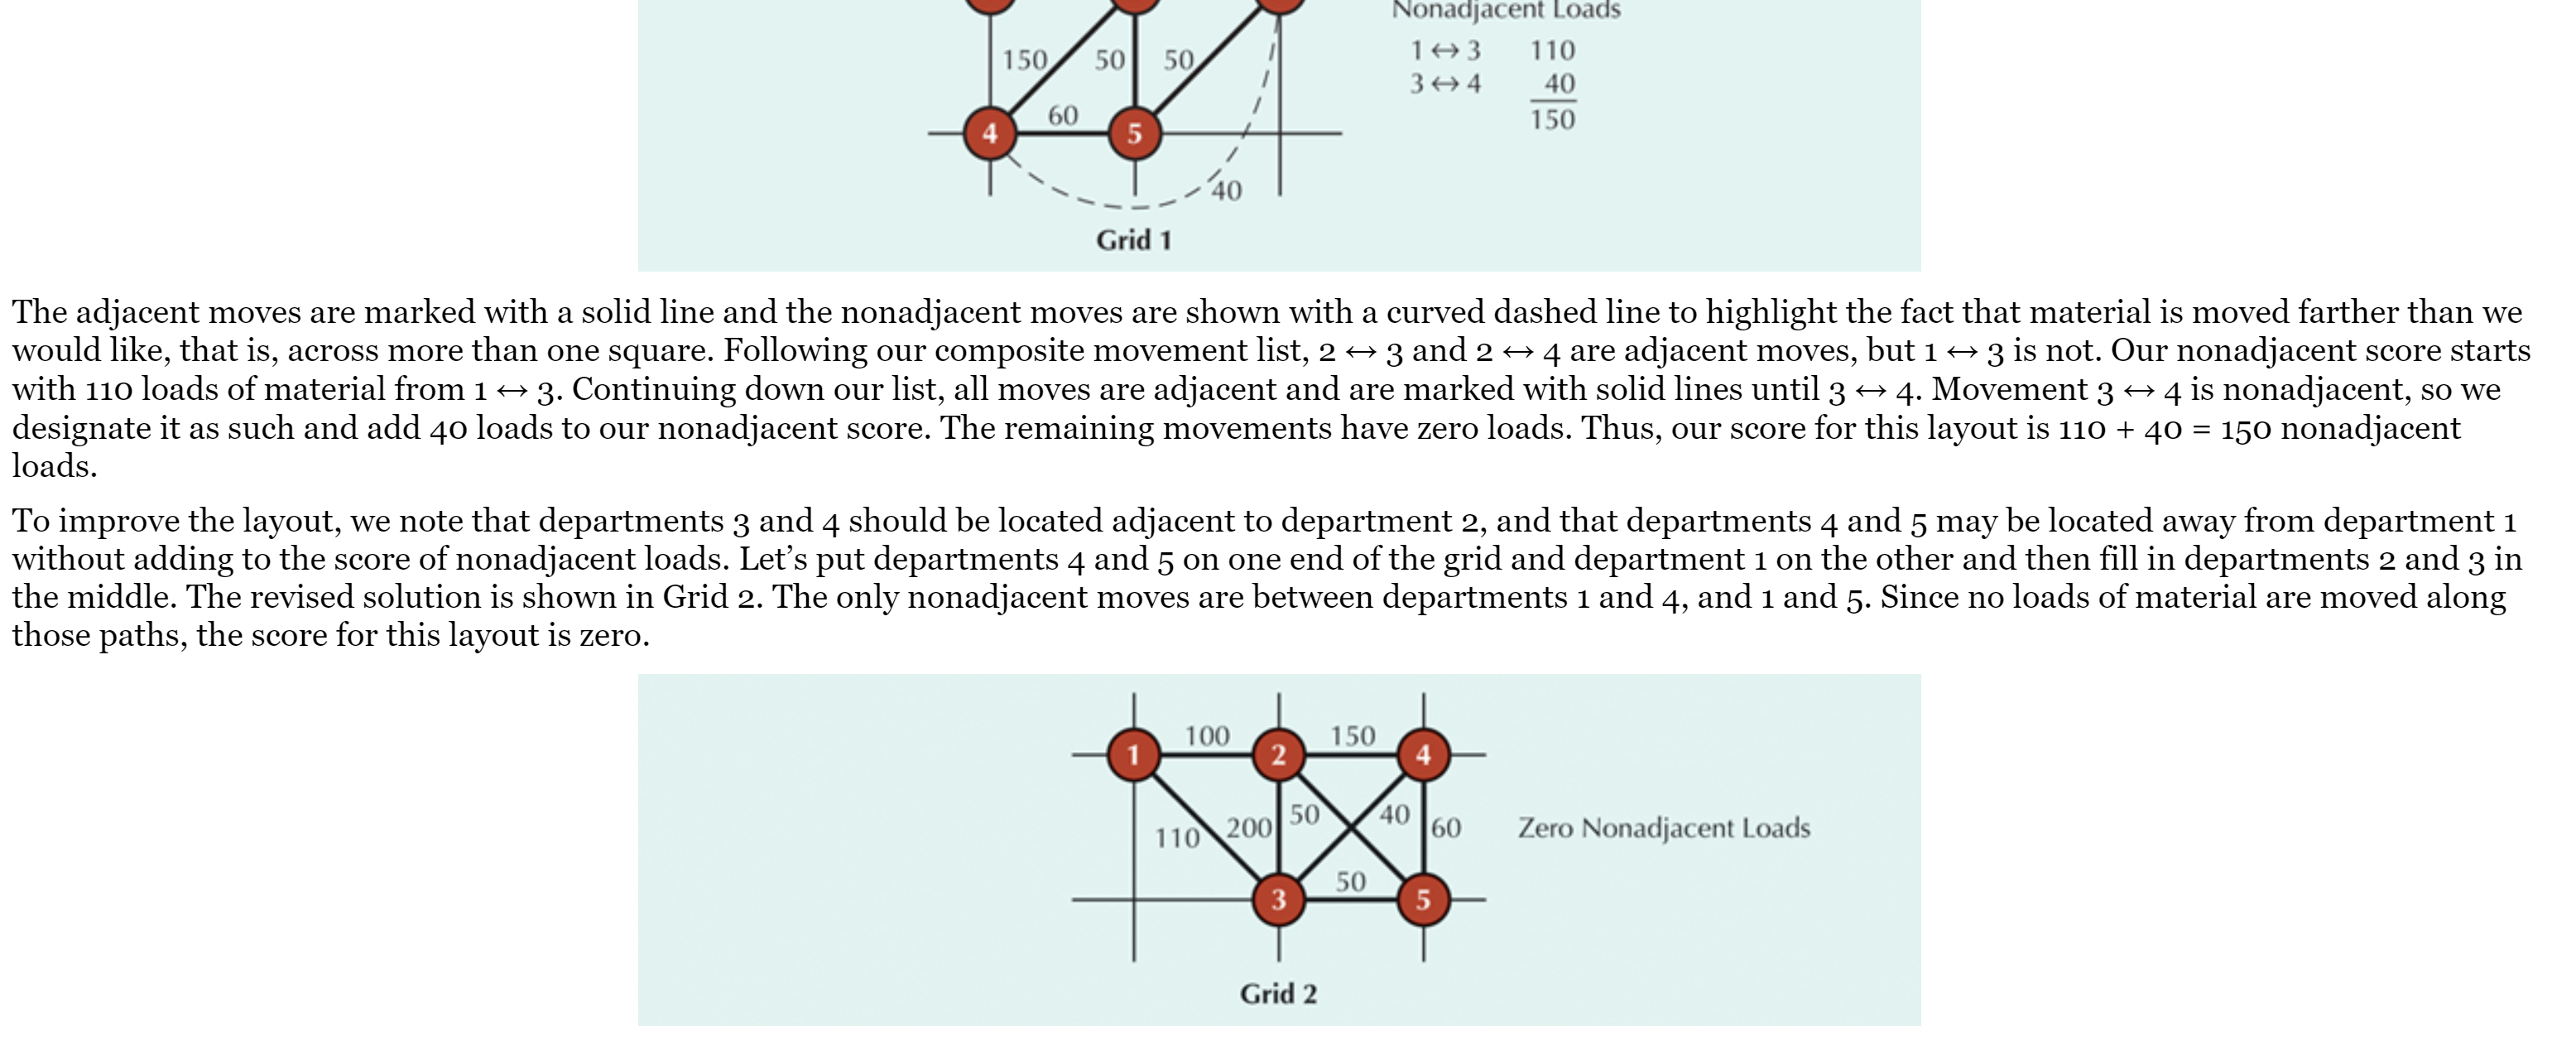
Problem 1 - 50 points Refer to Chapter 7 - example 7-1 Use the load summary chart below to arrange departments 1 through 9 on a 3 x 3 grid so that non-adjacent loads are minimized. Dept. 1 2 3 4 5 6 7 8 9 1 -- 50 100 25 60 65 2 40 -- 80 150 40 3 10 65 55 40 4 10 45 75 100 50 UT 25 50 -- 6 15 60 60 25 100 140 9 10 65sible, and the process of trying different layout of nonadjacent continues until an acceptable layout is found. EXHIBIT 7.1 A Process Layout with OM Tools in Excel Excel Process Layout - Excel File Home Insert Page Layout Formulas Data Review View Add-ins JMP Tell me what you want to do. 022 X V fx =SUMPRODUCT(C7:K15,C21:K29) A B C D E F G H K M N O P 1 Process Layout OM Student - Exhibit 7.1 2 Input load summary and trial layout. Excel will calculate Input: Load Summary Chart the non-adjacent loads. To improve the solution, change From \\ To Department the locations of departments, or try pairwise exchanges. Location Assigned Department Select the layout with the fewest nonadjacent loads. 1 2 3 5 7 100 50 Co 200 50 Enter departments here: AWN- 9 60 40 50 10 UI VN 100 60 11 50 N 12 13 14 15 Exchange 16 Departments 17 Calculations: 18 Distance Matrix Dept3 and Dept4 19 Distance DepartmentView Tell me what you want to do. File Home Insert Page Layout Formulas Data Review Add-ins JMP 022 X V fx =SUMPRODUCT(C7:K15,C21:K29) A B C D E F G H K M N O P 1 Process Layout OM Student - Exhibit 7.1 Input load summary and trial layout. Excel will calculate Input: Load Summary Chart the non-adjacent loads. To improve the solution, change QUIA WN the locations of departments, or try pairwise exchanges. Location From \\ To Department Select the layout with the fewest nonadjacent loads. Assigned Department 1 2 3 5 100 50 200 50 Enter departments here: 60 40 50 UNNA 10 100 60 AN- 11 50 12 14 15 Exchange 16 Departments 17 Calculations: 18 Distance Matrix Dept3 and Dept4 19 Distance Department 20 From \\ To 21 Output: 22 Nonadjacent loads = 40 oooooo OOOOON o - ooo oo - 0 - 23 UI AWN 24 25 26EXAMPLE 7.1 Process Layout Barko, Inc., makes bark scalpers, processing equipment that strips the bark off trees and turns it into nuggets or mulch for gardens. The facility that makes bark scalpers is a small-job shop that employs 50 workers and is arranged into five departments: (1) bar stock cutting, (2) sheet metal, (3) machining, (4) painting, and (5) assembly. The average number of loads transported between the five departments per month is given in the accompanying load summary chart. The current layout of the facility is shown schematically on the 2 x 3 grid. Notice that there is quite a bit of flexibility in the facility, as indicated by the six possible locations (i.e., intersections) available for five departments. In addition, the forklift used in the facility is very flexible, allowing horizontal, vertical, and diagonal movement of material. Load Summary Chart Department From/To Department 2 3 4 5 - 100 50 2 200 50 3 60 40 50 4 100 60 5 50'?_?_| Barko management anticipates that a new bark scalper plant will soon be necessary and would like to know if a similar layout should be used or if a better layout can be designed. You are asked to evaluate the current layout in terms of nonadjacent loads, and if needed, propose a new layout on a 2 x 3 grid that will minimize the number of nonadjacent loads. Solution: In order to evaluate the current layout, we need to calculate the composite, or backandforth, movements between departments. For example, the composite movement between department 1 and department 3 is the sum of 50 loads moved from 1 to 3, plus 60 loads moved from 3 to 1, or 110 loads of material. If we continue to calculate composite movements and rank them from highest to lowest, the following list results: Composite Movements Composite Movements 2 4 3 200 loads 3 4 5 50 loads 2 4 4 150 loads 2 4 5 50 loads 1 3 110 loads 3 4 4o loads 1 2 100 loads 1 4 o loads 4 5 60 loads 1 5 o loads Next, we evaluate the \"goodness" of the layout by scoring it in terms of nonadjacent loads. The results are shown visually in Grid 1. Nonadiacenl Loads 1H3 110 14-34 40 Nonadjacenl Loads 1H3 110 3H4 L0 150 Grid] The adjacent moves are marked with a solid line and the nonadjacent moves are shown with a curved dashed line to highlight the fact that material is moved farther than we would like, that is, across more than one square. Following our composite movement list, 2 (> 3 and 2 (> 4 are adjacent moves, but 1 3 is not. Our nonadjacent score starts with 110 loads of material from 1 3. Continuing down our list, all moves are adjacent and are marked with solid lines until 3 4. Movement 3 4 is nonadjacent, so we designate it as such and add 40 loads to our nonadjacent score. The remaining movements have zero loads. Thus, our score for this layout is 110 + 40 = 150 nonadjacent loads. To improve the layout, we note that departments 3 and 4 should be located adjacent to department 2, and that departments 4 and 5 may be located away from department 1 without adding to the score of nonadjacent loads. Let's put departments 4 and 5 on one end of the grid and department 1 on the other and then ll in departments 2 and 3 in the middle. The revised solution is shown in Grid 2. The only nonadjacent moves are between departments 1 and 4, and 1 and 5. Since no loads of material are moved along those paths, the score for this layout is zero. 60 Zero Nonadiacem Loads
Step by Step Solution
There are 3 Steps involved in it

Get step-by-step solutions from verified subject matter experts