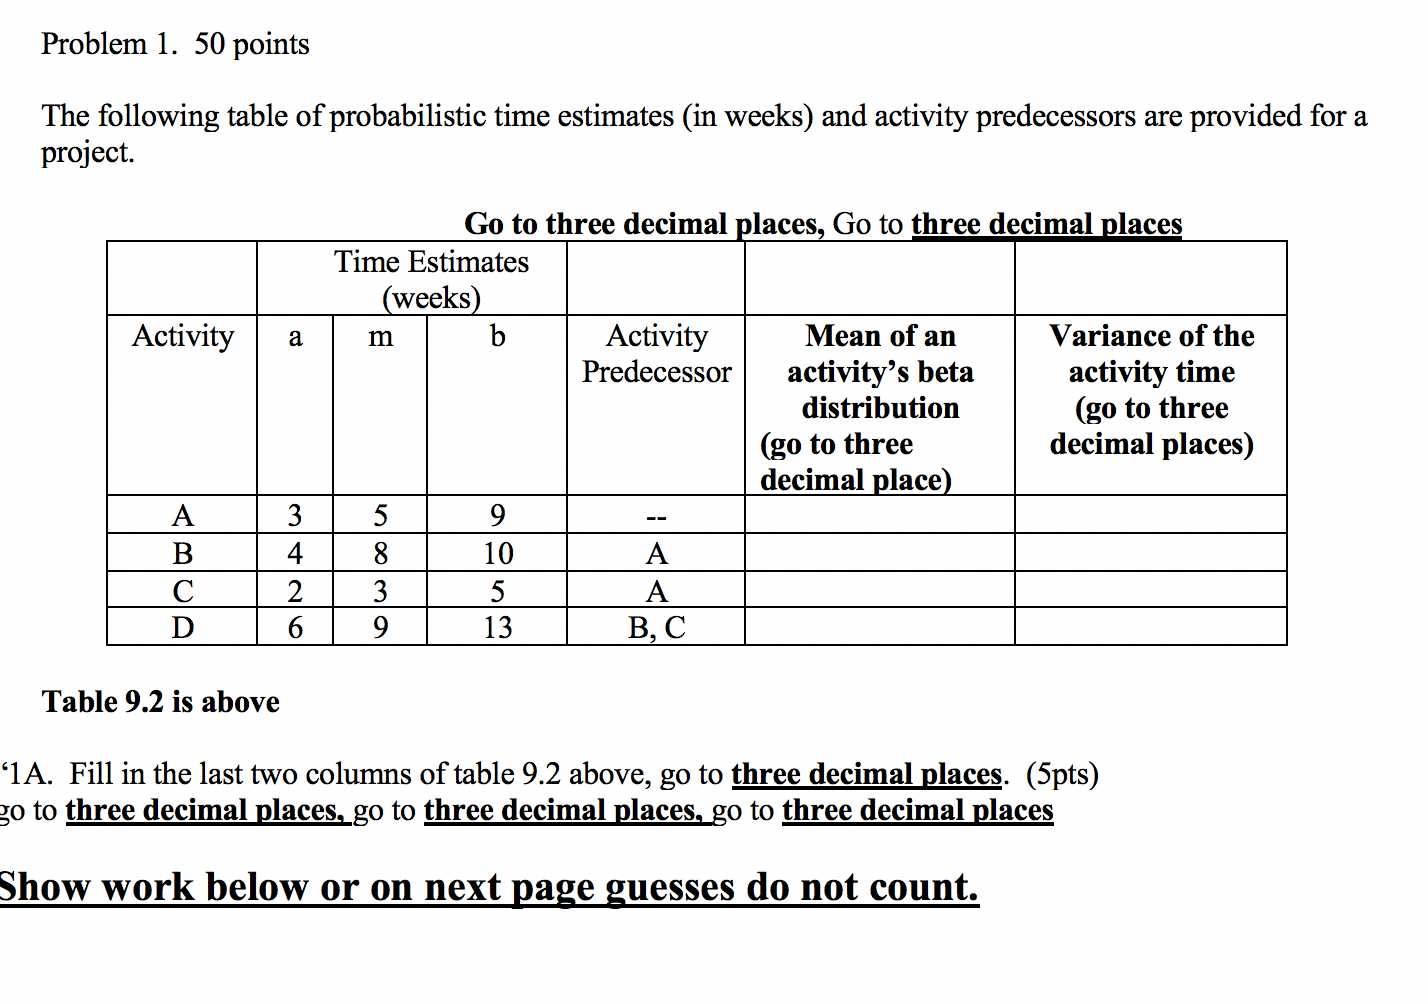
Question: Problem 1. 50 points The following table of probabilistic time estimates (in weeks) and activity predecessors are provided for a project. Go to three decimal

Problem 1. 50 points The following table of

Problem 1. 50 points The following table of

Problem 1. 50 points The following table of probabilistic time estimates (in weeks) and activity predecessors are provided for a project. Go to three decimal places, Go to three decimal places Time Estimates (weeks) Activity m Activity Mean of an Variance of the Predecessor activity's beta activity time distribution (go to three (go to three decimal places) decimal place) 15 8 10 A C2 | 3 5. A 9 13 B, C 9 Table 9.2 is above '1A. Fill in the last two columns of table 9.2 above, go to three decimal places. (5pts) go to three decimal places, go to three decimal places, go to three decimal places Show work below or on next page guesses do not count. Problem 1 continued '1b. Draw the network diagram below using activity on the node and list: ES, EF, LS, LF, and mean of an activity's beta distribution for each node. Use the information from Table 9.2. Go to three decimal places. (5 pts) Go to three decimal places. Go to three decimal places. Go to three decimal places Students draw a digram with the same format as below. The answer is not below. Just use below format. Draw answer on next page. S = 36 S = 41 S=0 Start S= I H 15959 Sa S =

Step by Step Solution

There are 3 Steps involved in it

1 Expert Approved Answer
Step: 1 Unlock blur-text-image
Question Has Been Solved by an Expert!

Get step-by-step solutions from verified subject matter experts

Step: 2 Unlock
Step: 3 Unlock

Students Have Also Explored These Related General Management Questions!