

Question: Problem 1 : A brown, reddish brown, and gray soil is being used to construct a low - permeability clay liner for a solid waste
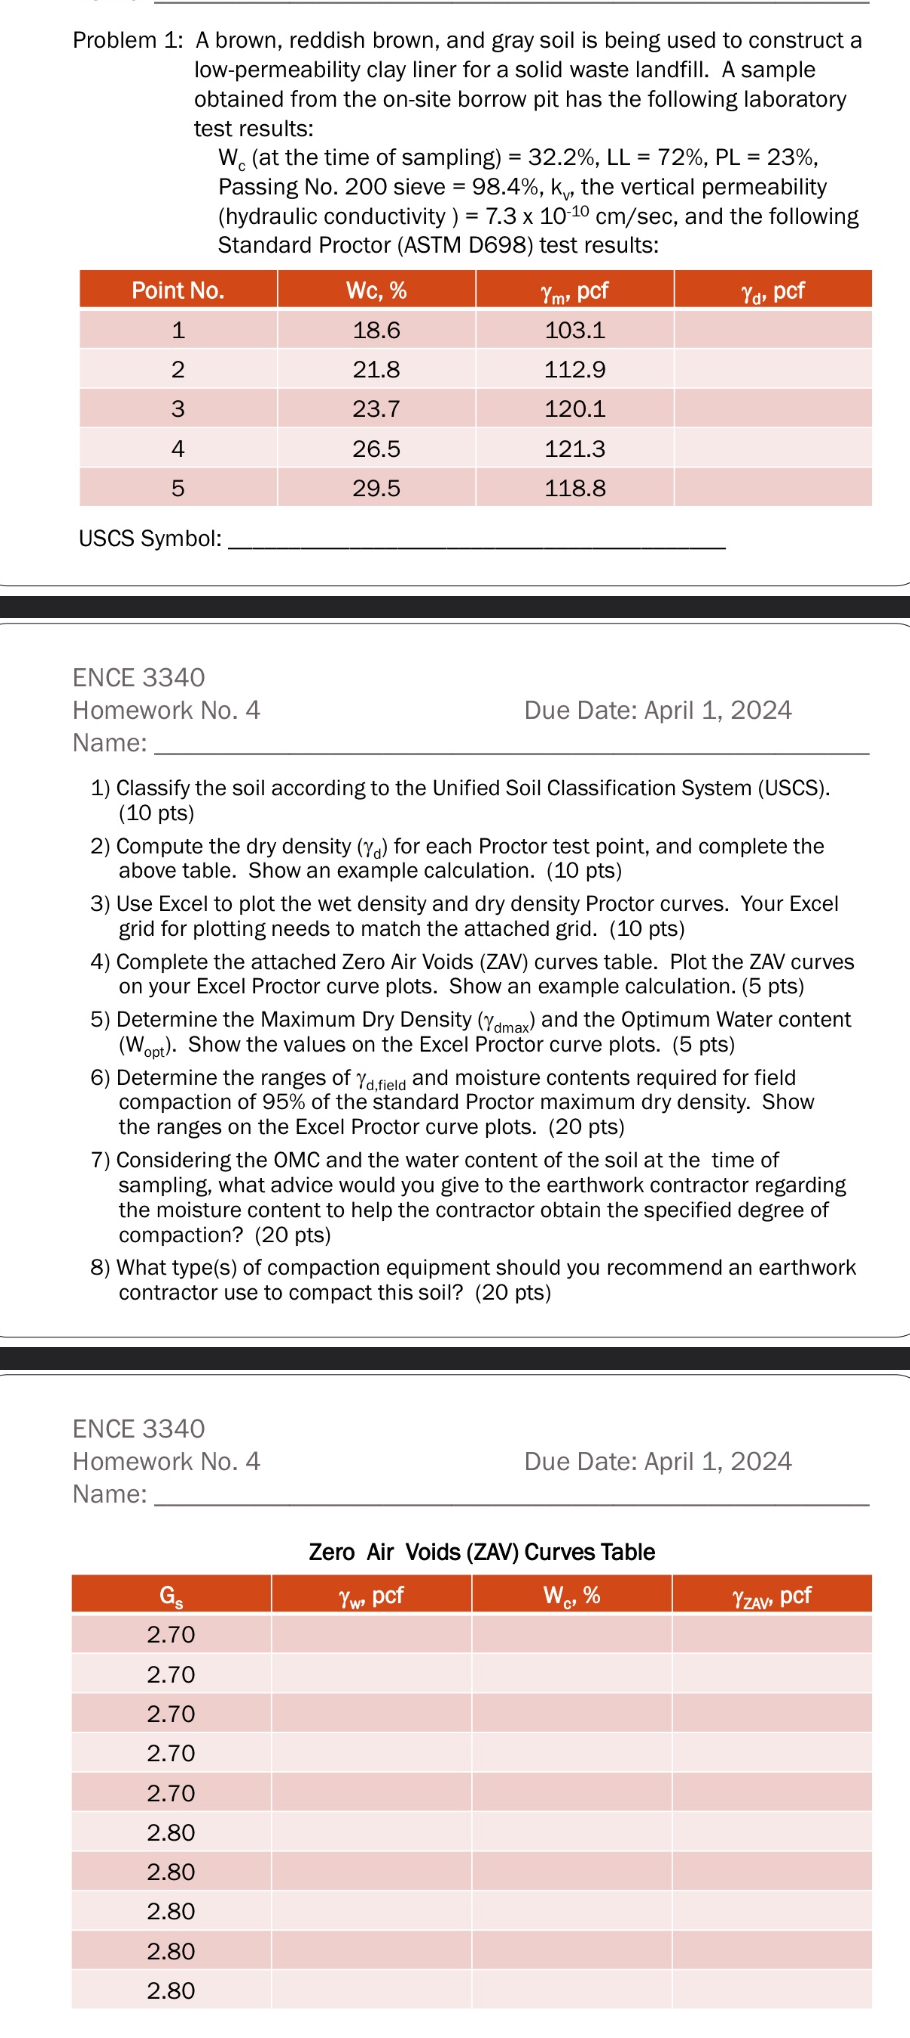
Problem : A brown, reddish brown, and gray soil is being used to construct a lowpermeability clay liner for a solid waste landfill. A sample obtained from the onsite borrow pit has the following laboratory test results:
at the time of sampling Passing No sieve the vertical permeability hydraulic conductivity and the following Standard Proctor ASTM D test results:
tablePoint NoWc pcf pcf
USCS Symbol:
ENCE
Homework No
Due Date: April
Name:
Classify the soil according to the Unified Soil Classification System USCS pts
Compute the dry density for each Proctor test point, and complete the above table. Show an example calculation. pts
Use Excel to plot the wet density and dry density Proctor curves. Your Excel grid for plotting needs to match the attached grid. pts
Complete the attached Zero Air Voids ZAV curves table. Plot the ZAV curves on your Excel Proctor curve plots. Show an example calculation. pts
Determine the Maximum Dry Density and the Optimum Water content Show the values on the Excel Proctor curve plots. pts
Determine the ranges of and moisture contents required for field compaction of of the standard Proctor maximum dry density. Show the ranges on the Excel Proctor curve plots. pts
Considering the OMC and the water content of the soil at the time of sampling, what advice would you give to the earthwork contractor regarding the moisture content to help the contractor obtain the specified degree of compaction? pts
What types of compaction equipment should you recommend an earthwork contractor use to compact this soil? pts
Zero Air Voids ZAV Curves Table
table pcf pcf
ENCE
Homework No
Due Date: April
Name:
Your Excel grid for the plotting required in Parts through of the assignment needs to match this grid. After completing your plotting, insert the plot into your PDF submittal. Conceptually, it chnuld he cimilar to the followino
Problem : A brown, reddish brown, and gray soil is being used to construct a lowpermeability clay liner for a solid waste landfill. A sample obtained from the onsite borrow pit has the following laboratory test results:
at the time of sampling
Passing No sieve the vertical permeability
hydraulic conductivity and the following Standard Proctor ASTM D test results:
tablePoint NoWc pcf pcf
USCS Symbol:
ENCE
Homework No
Due Date: April
Name:
Classify the soil according to the Unified Soil Classification System USCS pts
Compute the dry density for each Proctor test point, and complete the above table. Show an example calculation. pts
Use Excel to plot the wet density and dry density Proctor curves. Your Excel grid for plotting needs to match the attached grid. pts
Complete the attached Zero Air Voids ZAV curves table. Plot the ZAV curves on your Excel Proctor curve plots. Show an example calculation. pts
Determine the Maximum Dry Density and the Optimum Water content Show the values on the Excel Proctor curve plots. pts
Determine the ranges of and moisture contents required for field compaction of of the standard Proctor maximum dry density. Show the ranges on the Excel Proctor curve plots. pts
Considering the OMC and the water content of the soil at the time of sampling, what advice would you give to the earthwork contractor regarding the moisture content to help the contractor obtai
Please use Excel for the graph
Step by Step Solution
There are 3 Steps involved in it
1 Expert Approved Answer
Step: 1 Unlock

Question Has Been Solved by an Expert!
Get step-by-step solutions from verified subject matter experts
Step: 2 Unlock
Step: 3 Unlock