

Question: Problem 1 and 2 are under the same conditions. You need to enter the data into r studio. 1. Consider the following table of graduate
Problem 1 and 2 are under the same conditions. You need to enter the data into r studio.
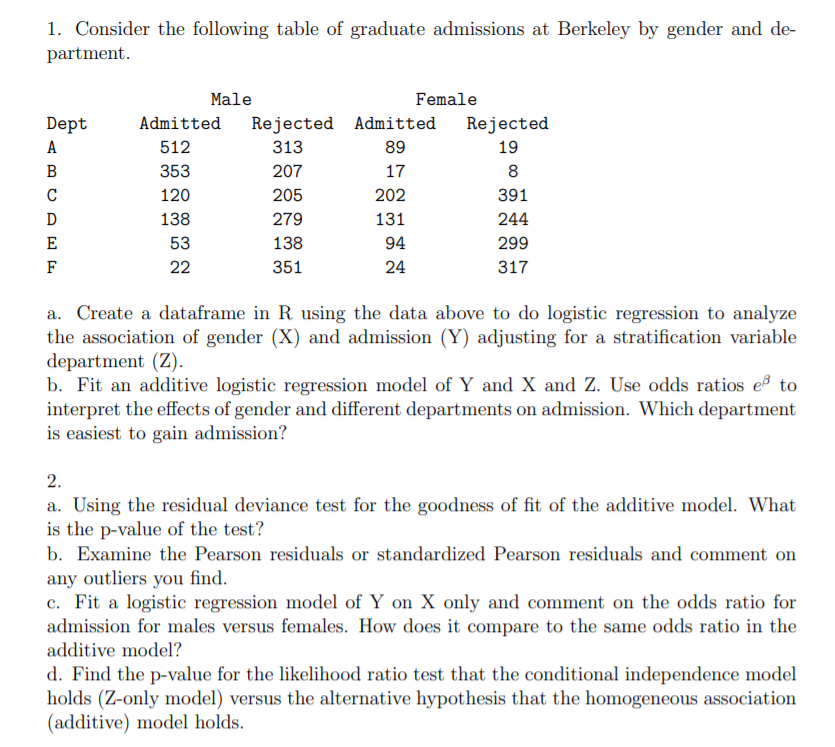
1. Consider the following table of graduate admissions at Berkeley by gender and de- partment. Hale Female Dept Admitted Rejected Admitted He j ected A 5 12 3 13 39 19 B 353 207 1? 3 C 120 205 202 391 D 133 279 131 244 E 53 138 94 299 F 22 35 1 24 317 a. Create a dataframe in B. using the data above to do logistic regression to analyze the association of gender (X) and admission (Y) adjusting for a stratication variable department (Z). 5. Fit an additive logistic regression model of Y and X and Z. Use odds ratios e5 to interpret the effects of gender and different departments on admission. Which department is easiest to gain admission? 2. a. Using the residual deviance test for the goodness of t of the additive model. What is the pvalue of the test? b. Examine the Pearson residuals or standardized Pearson residuals and comment on an).r outliers you nd. c. Fit a logistic regression model of Y on X only and comment on the odds ratio for admission for males versus females. How does it compare to the same odds ratio in the additive model? d. Find the pvalue for the likelihood ratio test that the conditional independence model holds (Zonl},r model) versus the alternative hypothesis that the homogeneous association (additive) model holds
Step by Step Solution
There are 3 Steps involved in it

Get step-by-step solutions from verified subject matter experts