

Question: Problem 1. Average inventory. An assumption we will be making on the sales of our hypothetical product is that they occur at a constant rate,

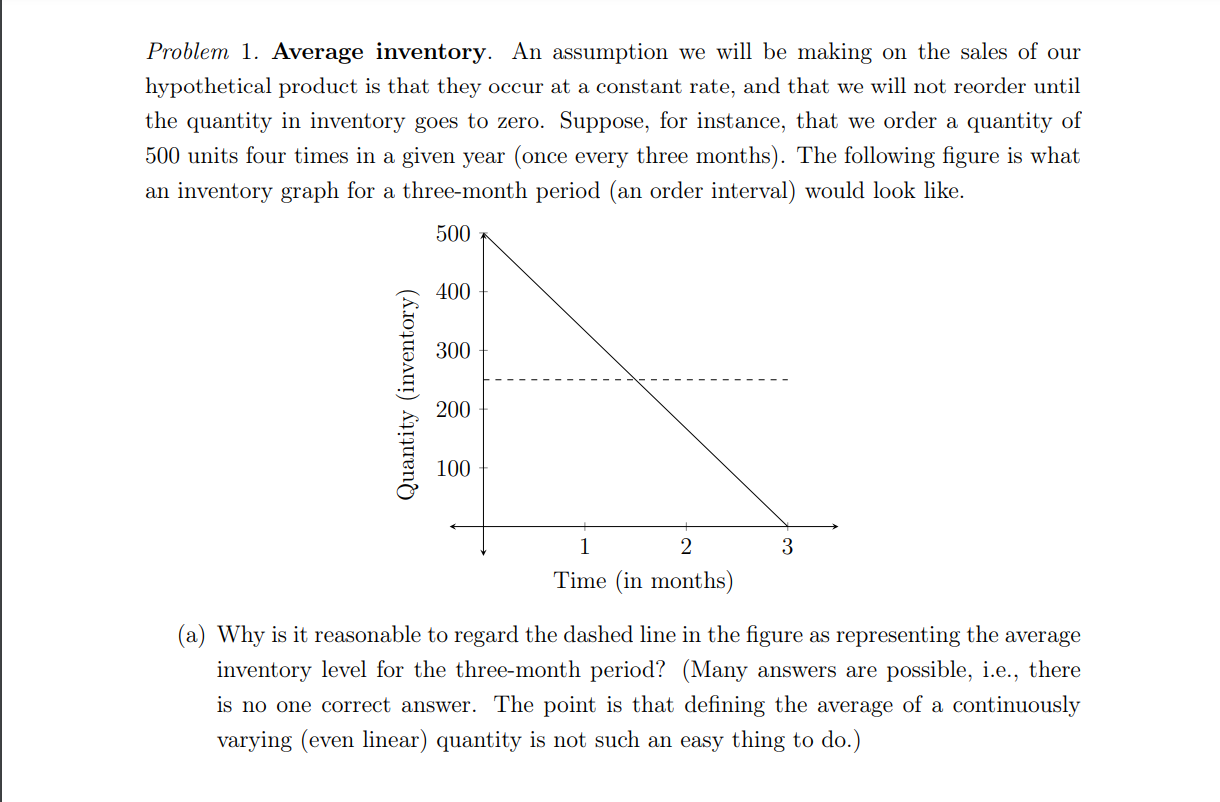
Problem 1. Average inventory. An assumption we will be making on the sales of our hypothetical product is that they occur at a constant rate, and that we will not reorder until the quantity in inventory goes to zero. Suppose, for instance. that we order a quantity of 500 units four times in a given year (once every three months). The following gure is what an inventory graph for a three-month period (an order interval) would look like. 500 M W H3 C C C O O O ._. D 0 Quantity (inventory) v 1 2 3 Time (in months) (a) Why is it reasonable to regard the dashed line in the gure as representing the average inventory level for the threemonth period? (Many answers are possible. i.e., there is no one correct answer. The point is that dening the average of a continuously varying (even linear) quantity is not such an easy thing to do.)
Step by Step Solution
There are 3 Steps involved in it

Get step-by-step solutions from verified subject matter experts