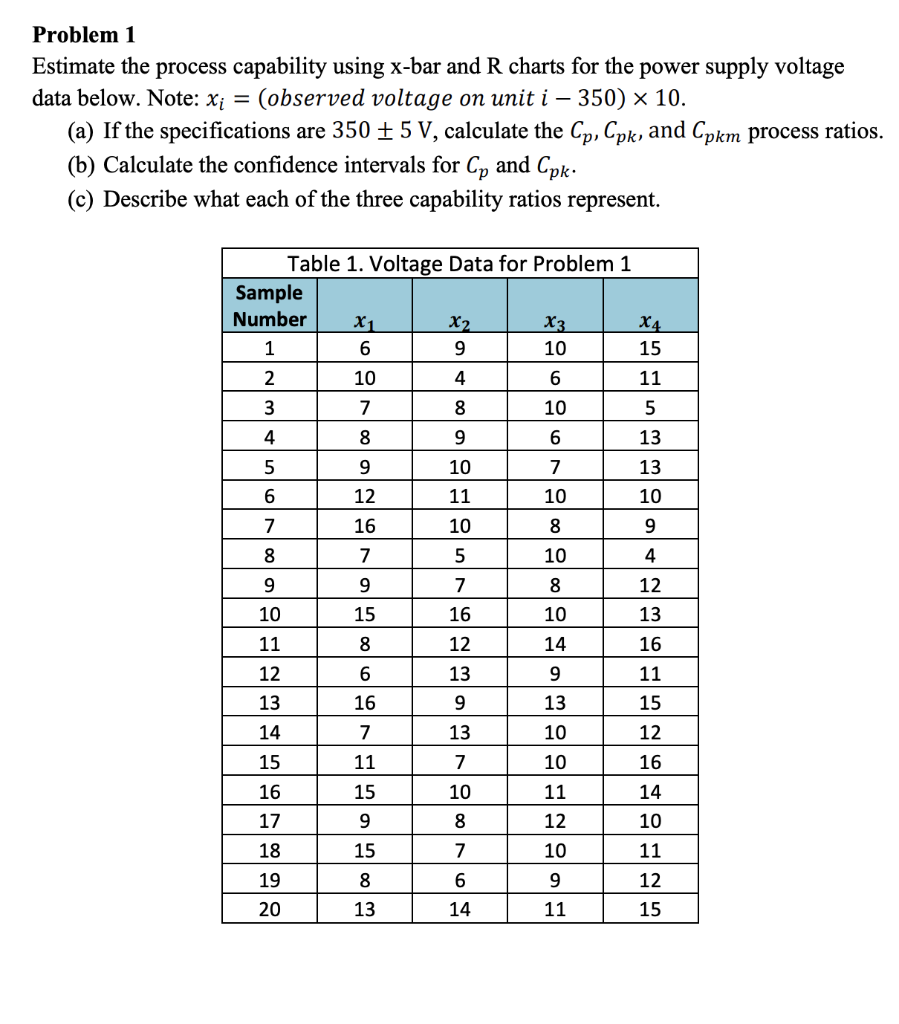
Question: Problem 1 Estimate the process capability using x-bar and R charts for the power supply voltage data below. Note: Xi (observed voltage on unit i

Problem 1 Estimate the process capability using

Problem 1 Estimate the process capability using x-bar and R charts for the power supply voltage data below. Note: Xi (observed voltage on unit i 350) x 10. (a) If the specifications are 350 5 V, calculate the Cp, Cpk, and Cpkm process ratios. (b) Calculate the confidence intervals for Cp and Cpk. (c) Describe what each of the three capability ratios represent. Table 1. Voltage Data for Problem 1 Sample Number X1 X2 X3 X4 1 6 9 10 15 2 10 4 6 11 3 7 8 10 5 4 8 9 6 13 5 9 10 7 13 6 12 11 10 10 7 16 10 |8|| 9 8 7 5 10 4 9 9 7 8 12 10 15 16 13 10 14 11 8 12 16 6 13 9 11 16 9 13 12 13 14 15 7 13 10 10 15 12 16 11 7 16 15 10 11 12 14 10 9 8 15 7 10 11 17 18 19 20 8 6 191 12 15 13 14 11

Step by Step Solution

There are 3 Steps involved in it

1 Expert Approved Answer
Step: 1 Unlock blur-text-image
Question Has Been Solved by an Expert!

Get step-by-step solutions from verified subject matter experts

Step: 2 Unlock
Step: 3 Unlock

Students Have Also Explored These Related General Management Questions!