Question: Problem 1: Financial Ratio Analysis: DuPont Model Consider three very different companies: Apple, Inc., develops, manufactures, and markets hardware personal devices, as well as software
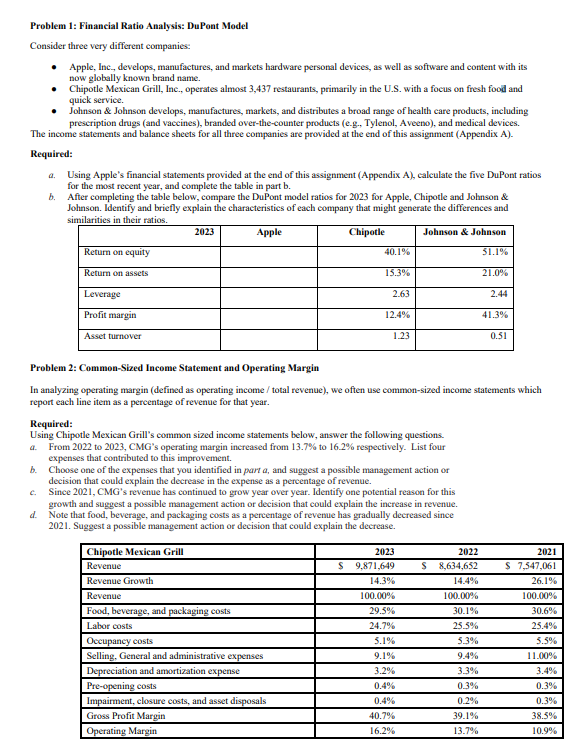
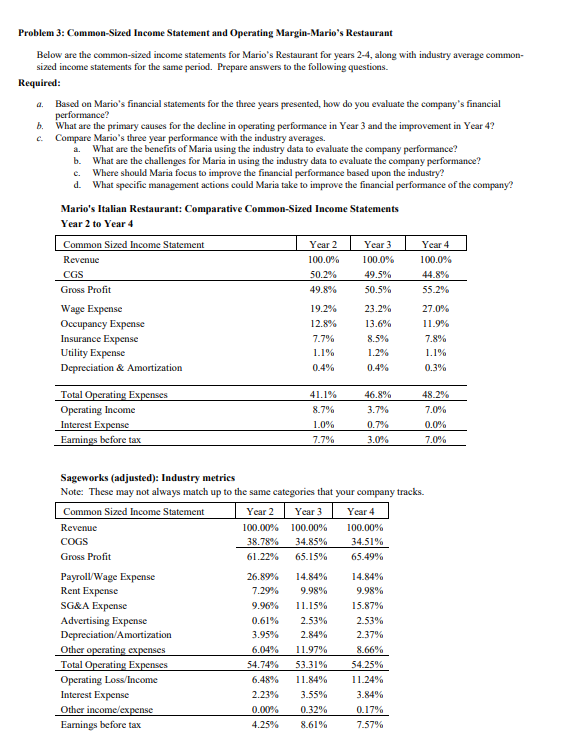
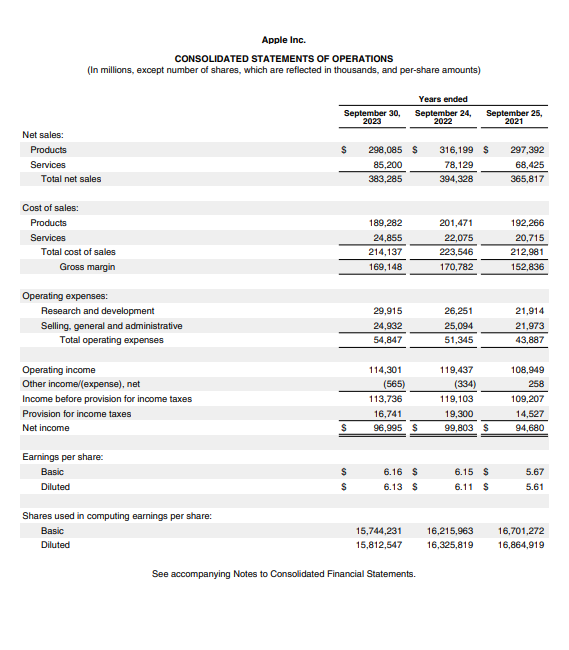
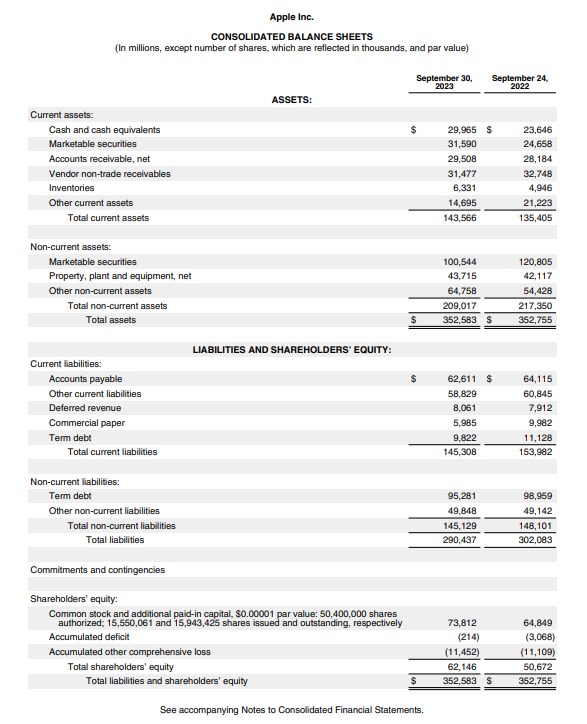
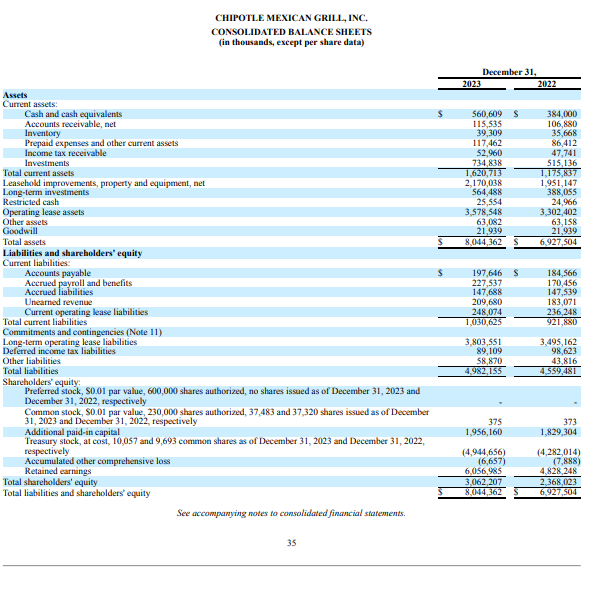
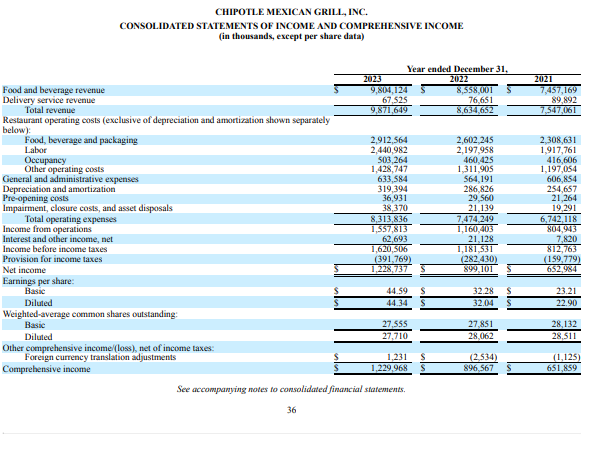
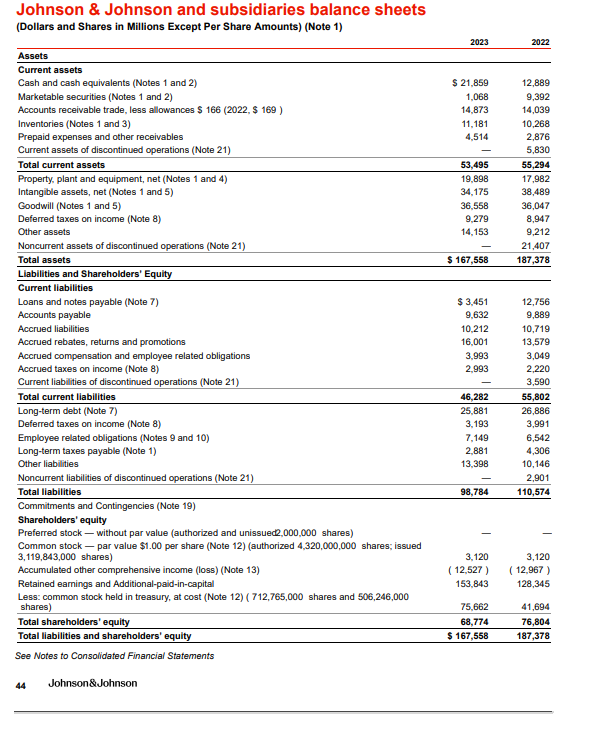
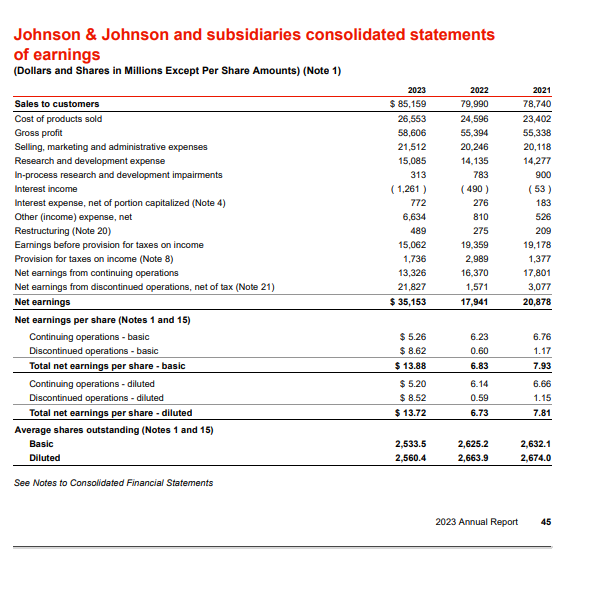
Problem 1: Financial Ratio Analysis: DuPont Model Consider three very different companies: Apple, Inc., develops, manufactures, and markets hardware personal devices, as well as software and content with its now globally known brand name. Chipotle Mexican Grill, Inc., operates almost 3,437 restaurants, primarily in the U.S. with a focus on fresh food and quick service. Johnson & Johnson develops, manufactures, markets, and distributes a broad range of health care products, including prescription drugs (and vaccines), branded over-the-counter products (e-g., Tylenol, Aveeno), and medical devices. The income statements and balance sheets for all three companies are provided at the end of this assignment (Appendix A)- Required: Using Apple's financial statements provided at the end of this assignment (Appendix A), calculate the five DuPont ratios for the most recent year, and complete the table in part b. b. After completing the table below, compare the DuPont model ratios for 2023 for Apple, Chipotle and Johnson & Johnson. Identify and briefly explain the characteristics of each company that might generate the differences and similarities in their ratios. 2023 Apple Chipotle Johnson & Johnson Return on equity 40.1% 31.1% Return on assets 15.3% 21.0% Leverage 2.63 2.44 Profit margin 12.4% 41.3% Asset turnover 1.23 0.51 Problem 2: Common-Sized Income Statement and Operating Margin In analyzing operating margin (defined as operating income / total revenue), we often use common-sized income statements which report each line item as a percentage of revenue for that year. Required: Using Chipotle Mexican Grill's common sized income statements below, answer the following questions. From 2022 to 2023, CMG's operating margin increased from 13.7% to 16.2% respectively. List four expenses that contributed to this improvement. b. Choose one of the expenses that you identified in part a, and suggest a possible management action or decision that could explain the decrease in the expense as a percentage of revenue. C. Since 2021, CMG's revenue has continued to grow year over year. Identify one potential reason for this growth and suggest a possible management action or decision that could explain the increase in revenue. d. Note that food, beverage, and packaging costs as a percentage of revenue has gradually decreased since 2021. Suggest a possible management action or decision that could explain the decrease. Chipotle Mexican Grill 2023 2022 2021 Revenue $ 9,871,649 S 8,634.652 $ 7.547.061 Revenue Growth 14.3% 4.4%% 26.1% Revenue 100.00% 100.00% 100 00% Food, beverage, and packaging costs 29.5% 30.1% 50.6% Labor costs 24.7% 25.4% Occupancy costs 5.1% 5.3% 5.5% Selling. General and administrative expenses 9.1% 9.4% 1 00% Depreciation and amortization expense 3.2% 1.49% Pre-opening costs 1.4% 13% 1.3% Impairment, closure costs, and asset disposals 0.4% 0.2% 0.3% Gross Profit Margin 10.7% 39.1% $8.5% Operating Margin 6.2% 3.7% 10.9%Problem 3: Common-Sized Income Statement and Operating Margin-Mario's Restaurant Below are the common-sized income statements for Mario's Restaurant for years 2-4, along with industry average common- sized income statements for the same period. Prepare answers to the following questions. Required: Based on Mario's financial statements for the three years presented, how do you evaluate the company's financial performance? b. What are the primary causes for the decline in operating performance in Year 3 and the improvement in Year 4? Compare Mario's three year performance with the industry averages. a. What are the benefits of Maria using the industry data to evaluate the company performance? b. What are the challenges for Maria in using the industry data to evaluate the company performance? C. Where should Maria focus to improve the financial performance based upon the industry? d What specific management actions could Maria take to improve the financial performance of the company? Mario's Italian Restaurant: Comparative Common-Sized Income Statements Year 2 to Year 4 Common Sized Income Statement Year 2 Year 3 Year 4 Revenue 100.0% 100.0% 100.0% CGS 50.2% 49.5% 44.8% Gross Profit 19.8% 50.5% 55-2% Wage Expense 19.2% 23.2% 27.0% Occupancy Expense 12.8% 13.6% 11.9% Insurance Expense 7.7% 8.5% 7.8% Utility Expense 1.1% 1.2% 1.1% Depreciation & Amortization 0.4% 0.4% 0.3% Total Operating Expenses 41.1% 46.8% 48.2% Operating Income 8.7% 3.7% 7.0% Interest Expense 1.0% 0.7% 0.0% Earnings before tax 7.7% 3.0% 7.0% Sageworks (adjusted): Industry metrics Note: These may not always match up to the same categories that your company tracks. Common Sized Income Statement Year 2 Year 3 Year 4 Revenue 100.00% 100 00% 100.00% COGS 38.78% 34.85% 34.51% Gross Profit 61.22% 65.15% 65.49% Payroll/Wage Expense 26.89% 14.84% 14.84% Rent Expense 7.29% 9.98% 9.98% SG&A Expense 9.96% 11.15% 15.87% Advertising Expense 0.61% 2.53% 2.53% Depreciation/Amortization 3.95% 2.84% 2.37% Other operating expenses 6.04% 1 1.97% 8.66% Total Operating Expenses 54.74 53.31% 54-25% Operating Loss/Income 6.48 1 1.84% 1 1.24% Interest Expense 2.23% 3.55% 3.84% Other income/expense 0.00% 0.32% 0.17% Earnings before tax 4.25% 8.61% 7.57%Apple Inc. CONSOLIDATED STATEMENTS OF OPERATIONS (In millions, except number of shares, which are reflected in thousands, and per-share amounts) Years ended September 30 September 24, September 25, 2020 2022 2021 Net sales: Products 298,085 S 316,199 S 297,392 Services 85,200 78, 129 68,425 Total net sales 383,285 394,328 365,817 Cost of sales: Products 189,282 201,471 192,266 Services 24,855 22.075 20,715 Total cost of sales 214,137 223,546 212,981 Gross margin 169,148 170,782 152,836 Operating expenses: Research and development 29,915 26,251 21,914 Selling, general and administrative 24,932 25,094 21,973 Total operating expenses 54,847 51,345 13.887 Operating income 114,301 119,437 108,949 Other income/(expense), net 565) 334) Income before provision for income taxes 113,736 119,103 109,207 Provision for income taxes 16,741 19,300 14,527 Net income S 96,985 S 99,803 S 34,680 Earnings per share: Basic 6.16 5 6.15 $ 5.67 Diluted 6.13 $ 6.11 5 5.61 Shares used in computing earnings per share: Basic 15,744,231 16,215,963 16,701,272 Diluted 15,812,547 16,325,819 16,864,919 See accompanying Notes to Consolidated Financial Statements.Apple Inc. CONSOLIDATED BALANCE SHEETS (In millions, except number of shares, which are reflected in thousands, and par value) September 30, September 24. 2023 2022 ASSETS: Current assets: Cash and cash equivalents 29,965 $ 23,646 Marketable securities 31,590 24.658 Accounts receivable, net 29,508 28, 184 Vendor non-trade receivables 31,477 32,748 Inventories 6,331 4,946 Other current assets 14.695 21,223 Total current assets 143,566 135,405 Non-current assets: Marketable securities 100,544 120,805 Property, plant and equipment, net 43,715 42,117 Other non-current assets 64,758 54,428 Total non-current assets 209,017 217,350 Total assets $ 352,583 $ 352,755 LIABILITIES AND SHAREHOLDERS' EQUITY: Current liabilities: Accounts payable $ 62,611 $ 64,115 Other current liabilities 58,829 60,845 Deferred revenue 8,061 7,912 Commercial paper 5,985 9,982 Term debt 9.822 11,128 Total current liabilities 145,308 153,982 Non-current liabilities: Term debi 95,281 98,959 Other non-current liabilities 49,848 49,142 Total non-current liabilities 145,129 148,101 Total liabilities 290.437 302.083 Commitments and contingencies Shareholders' equity: Common stock and additional paid-in capital, $0.00001 par value: 50,400,000 shares authorized; 15,550,061 and 15,943,425 shares issued and outstanding, respectively 73,812 64,849 Accumulated deficit (214) (3,068) Accumulated other comprehensive loss (11,452) (1 1, 109) Total shareholders' equity 32,146 50,672 Total liabilities and shareholders' equity 352,583 $ 352,755 See accompanying Notes to Consolidated Financial Statements.CHIPOTLE MEXICAN GRILL, INC. CONSOLIDATED BALANCE SHEETS (in thousands, except per share data) December 31, 2023 2022 Assets Current assets: Cash and cash equivalents 560 609 5 384,000 Accounts receivable, net 115,535 106,880 Inventory 39,309 35,668 Prepaid expenses and other current assels 117,462 86,412 Income tax receivable 52,960 47,741 Investment 734,838 515,136 Total current abel: 1,620,713 1,175,837 Leasehold improvements, property and equipment, net 2,170,038 1,951,147 Long-term investments 564,488 388,055 Restricted cash 25,554 24,966 Operating lease assets 3,578,548 3,302, 402 Other assets 63,082 63,158 Goodwill 21 939 21,939 Total assets 8,044,362 6,927,504 Liabilities and shareholders' equity Current liabilities: Accounts payable 197,646 S 184,566 Accrued payroll and benefits 227,537 170,456 Accrued liabilities 147,688 147,539 Unearned revenue 209,680 183,071 Current operating lease liabilities 248,074 236,248 Total current liabilities 1,030,625 921 880 Commitments and contingencies (Note 11) Long-term operating lease liabilities 3,803 551 3,495,162 Deferred income tax liabilities 89, 109 98,623 Other liabilities 58,870 13,816 Total liabilities 4,982,155 4,559,481 Shareholders' equity: Preferred stock, $0.01 par value, 600,000 shares authorized, no shares issued as of December 31, 2023 and December 31, 2022, respectively Common stock, $0.01 par value, 230,000 shares authorized, 37,483 and 37,320 shares issued as of December 31, 2023 and December 31, 2022, respectively 375 373 Additional paid-in capital 1,956,160 1,829,304 Treasury stock, at cost, 10,057 and 9,693 common shares as of December 31, 2023 and December 31, 2022, respectively (4,944,656) (4,282,014) Accumulated other comprehensive loss (6,657) (7,888) Retained earnings 6,056,985 4,828,248 Total shareholders' equity 3,062,207 2,368,023 Total liabilities and shareholders' equity 8,044,362 6,927,504 See accompanying notes to consolidated financial statements. 35CHIPOTLE MEXICAN GRILL, INC. CONSOLIDATED STATEMENTS OF INCOME AND COMPREHENSIVE INCOME (in thousands, except per share data) Year ended December 31, Food and beverage revenue 9,804, 124 8,558,001 7,457,169 Delivery service revenue 67,525 76.651 89 892 Total revenue 9,871,649 8,634,652 7,547,061 Restaurant operating costs (exclusive of depreciation and amortization shown separately below ): Food, beverage and packaging 2,912,564 2,602 245 2,308,631 Labor 2,440,982 2,197,958 1,917,761 Occupancy 503,264 460,425 416,606 Other operating costs 1,428,747 1,311,905 1,197,054 General and administrative expenses 633,584 564,191 606,854 Depreciation and amortization 319,394 286,826 254,657 Pre-opening cools 36,931 29,560 21,264 Impairment, closure costs, and asset disposals 38,370 21,139 19 291 Total operating expenses 8,313,836 7,474,249 6,742,118 Income from operations 1,557,813 1,160,403 804,943 Interest and other income, net 62,693 21,128 7,820 Income before income taxes 1,620,506 1,181,531 812, 763 Provision for income laxes (391 769) 282 430) (159,779) Net income 1,228,737 $99,101 652,984 Earnings per share: Basic 44.59 32.28 23.21 Diluted 44.34 32.04 22 90 Weighted average common shares outstanding: Basic 27,555 27,851 28, 132 Diluted 27,710 28.062 28,511 Other comprehensive income (loss), net of income taxes: Foreign currency translation adjustments 1,231 S (2,534 (1,125) Comprehensive income 1,229,968 896.567 S 651 859 See accompanying notes to consolidated financial statements. 36Johnson & Johnson and subsidiaries balance sheets (Dollars and Shares in Millions Except Per Share Amounts) (Note 1) 2023 2022 Assets Current assets Cash and cash equivalents (Notes 1 and 2) $ 21,859 12,889 Marketable securities (Notes 1 and 2) 1,068 9,392 Accounts receivable trade, less allowances $ 166 (2022, $ 169 ) 14.873 14,039 Inventories (Notes 1 and 3) 11,181 10,268 Prepaid expenses and other receivables 4,514 2,876 Current assets of discontinued operations (Note 21) 5,830 Total current assets 53,495 55,294 Property, plant and equipment, net (Notes 1 and 4) 19.898 17,982 Intangible assets, net (Notes 1 and 5) 34,175 38,489 Goodwill (Notes 1 and 5) 36.558 36,047 Deferred taxes on income (Note 8) 9.279 8,947 Other assets 14,153 9,212 Noncurrent assets of discontinued operations (Note 21) 21,407 Total assets $ 167,558 187,378 Liabilities and Shareholders' Equity Current liabilities Loans and notes payable (Note 7) $ 3.451 12,756 Accounts payable 9.632 9.889 Accrued liabilities 10.212 10,719 Accrued rebates, returns and promotions 16,001 13,579 Accrued compensation and employee related obligations 3.993 3,049 Accrued taxes on income (Note 8) 2.993 2,220 Current liabilities of discontinued operations (Note 21) 3,590 Total current liabilities 46,282 55,802 Long-term debt (Note 7) 25.881 26,886 Deferred taxes on income (Note 8) 3,193 3,991 Employee related obligations (Notes 9 and 10) 7.149 6,542 Long-term taxes payable (Note 1) 2,881 4,306 Other liabilities 13.398 10,146 Noncurrent liabilities of discontinued operations (Note 21) 2,901 Total liabilities 98,784 110,574 Commitments and Contingencies (Note 19) Shareholders' equity Preferred stock - without par value (authorized and unissued2,000,000 shares) Common stock - par value $1.00 per share (Note 12) (authorized 4,320,000,000 shares; issued 3,119,843,000 shares) 3.120 3,120 Accumulated other comprehensive income (loss) (Note 13) ( 12,527 ) ( 12,967 ) Retained earnings and Additional-paid-in-capital 153.843 128,345 Less: common stock held in treasury, at cost (Note 12) ( 712,765,000 shares and 506,246,000 shares 75.662 41,694 Total shareholders' equity 68,774 76,804 Total liabilities and shareholders' equity $ 167,558 187,378 See Notes to Consolidated Financial Statements 44 Johnson & JohnsonJohnson & Johnson and subsidiaries consolidated statements of earnings (Dollars and Shares in Millions Except Per Share Amounts) (Note 1) 2023 2022 2021 Sales to customers $ 85,159 79 990 78,740 Cost of products sold 26,553 24,596 23,402 Gross profit 58,606 55,394 55,338 Selling, marketing and administrative expenses 21,512 20 246 20,118 Research and development expense 15,085 14,135 14,277 In-process research and development impairments 313 783 900 Interest income ( 1,261 ) ( 490 ) ( 53) Interest expense, net of portion capitalized (Note 4) 772 276 183 Other (income) expense, net 6,634 810 526 Restructuring (Note 20) 489 275 204 Earnings before provision for taxes on income 15,062 19.359 19,178 Provision for taxes on income (Note 8) 1,736 2.989 1,377 Net earnings from continuing operations 13,326 16.370 17,801 Net earnings from discontinued operations, net of tax (Note 21) 21,827 1,571 3,077 Net earnings $ 35,153 17,941 20,878 Net earnings per share (Notes 1 and 15) Continuing operations - basic $ 5.26 6.23 6.76 Discontinued operations - basic $ 8.62 0.60 1.17 Total net earnings per share - basic $ 13.88 6.83 7.93 Continuing operations - diluted $ 5.20 6.14 6.66 Discontinued operations - diluted $ 8.52 0.58 1.15 Total net earnings per share - diluted $ 13.72 6.73 7.81 Average shares outstanding (Notes 1 and 15) Basic 2,533.5 2,625.2 2,632.1 Diluted 2,560.4 2,663.9 2,674.0 See Notes to Consolidated Financial Statements 2023 Annual Report 45
Step by Step Solution
There are 3 Steps involved in it
1 Expert Approved Answer
Step: 1 Unlock
Question Has Been Solved by an Expert!
Get step-by-step solutions from verified subject matter experts
Step: 2 Unlock
Step: 3 Unlock
Students Have Also Explored These Related Finance Questions!