

Question: Problem 1 . Following traffic volumes ( v e h h ) were recorded for an eastbound section of freeway during the peak hour. 1
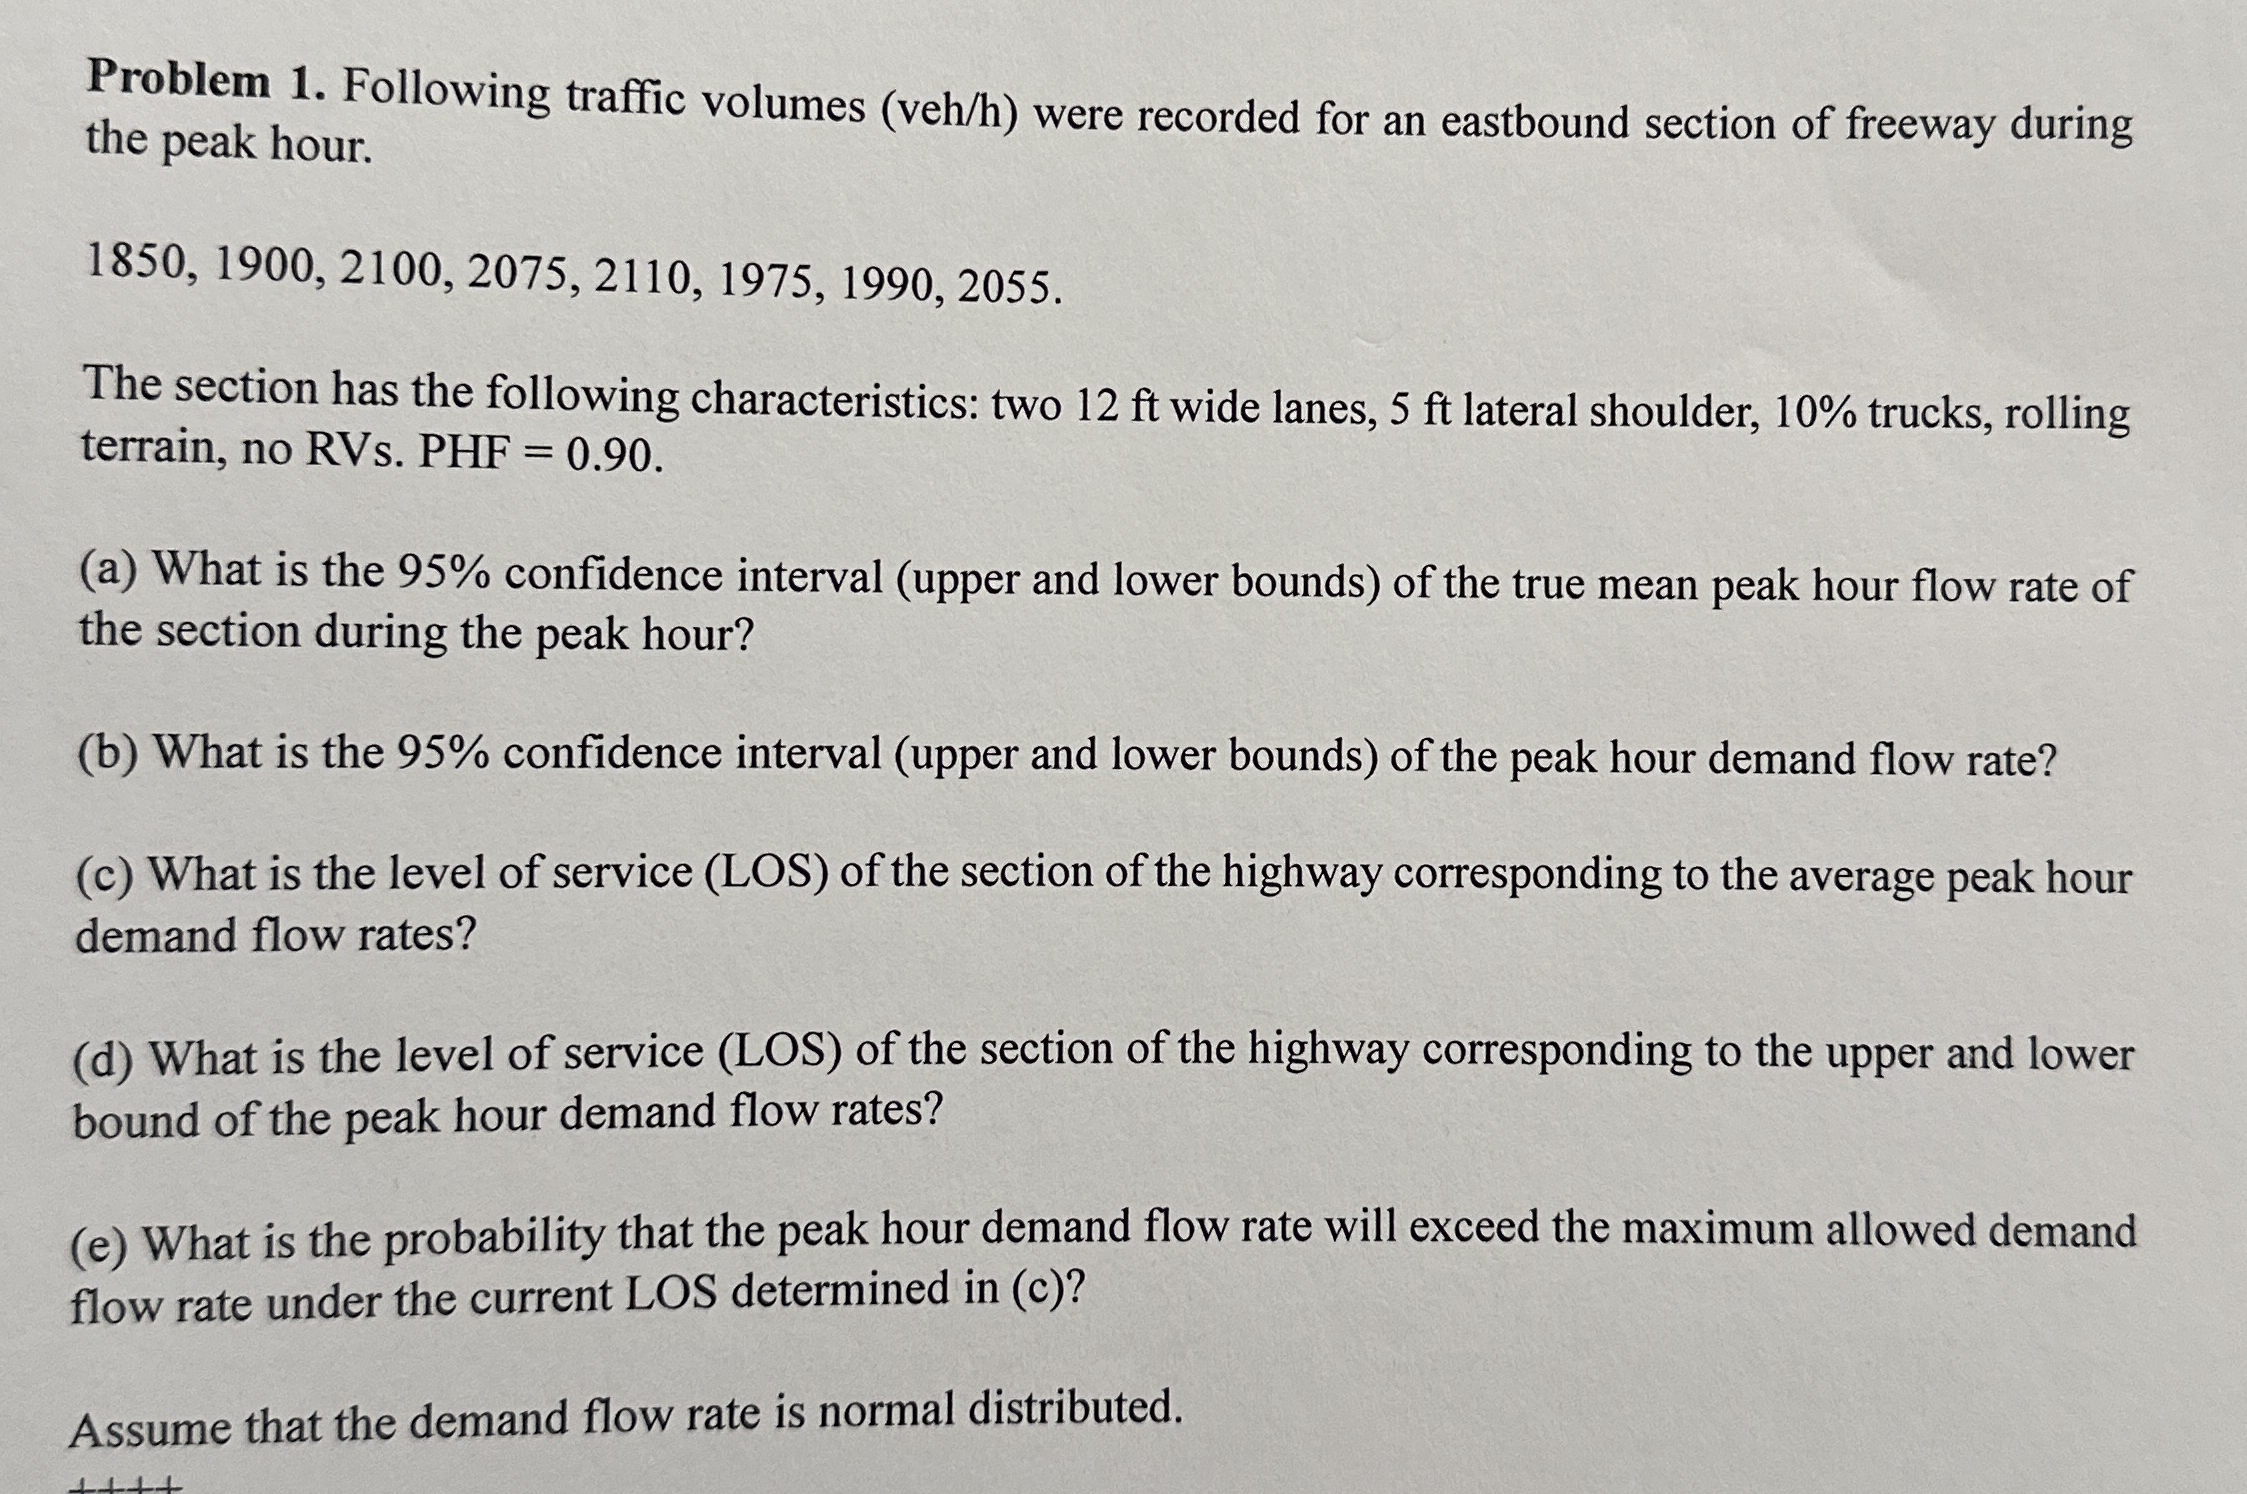
Problem Following traffic volumes were recorded for an eastbound section of freeway during the peak hour.
The section has the following characteristics: two ft wide lanes, ft lateral shoulder, trucks, rolling terrain, no RVs PHF
a What is the confidence interval upper and lower bounds of the true mean peak hour flow rate of the section during the peak hour?
b What is the confidence interval upper and lower bounds of the peak hour demand flow rate?
c What is the level of service LOS of the section of the highway corresponding to the average peak hour demand flow rates?
d What is the level of service LOS of the section of the highway corresponding to the upper and lower bound of the peak hour demand flow rates?
e What is the probability that the peak hour demand flow rate will exceed the maximum allowed demand flow rate under the current LOS determined in c
Assume that the demand flow rate is normal distributed.
Step by Step Solution
There are 3 Steps involved in it
1 Expert Approved Answer
Step: 1 Unlock

Question Has Been Solved by an Expert!
Get step-by-step solutions from verified subject matter experts
Step: 2 Unlock
Step: 3 Unlock