

Question: Problem 1 For the following problem please refer to Table 1 Table 1: Historical Annual Volatilities and Correlations for Selected Stocks (based on monthly returns,
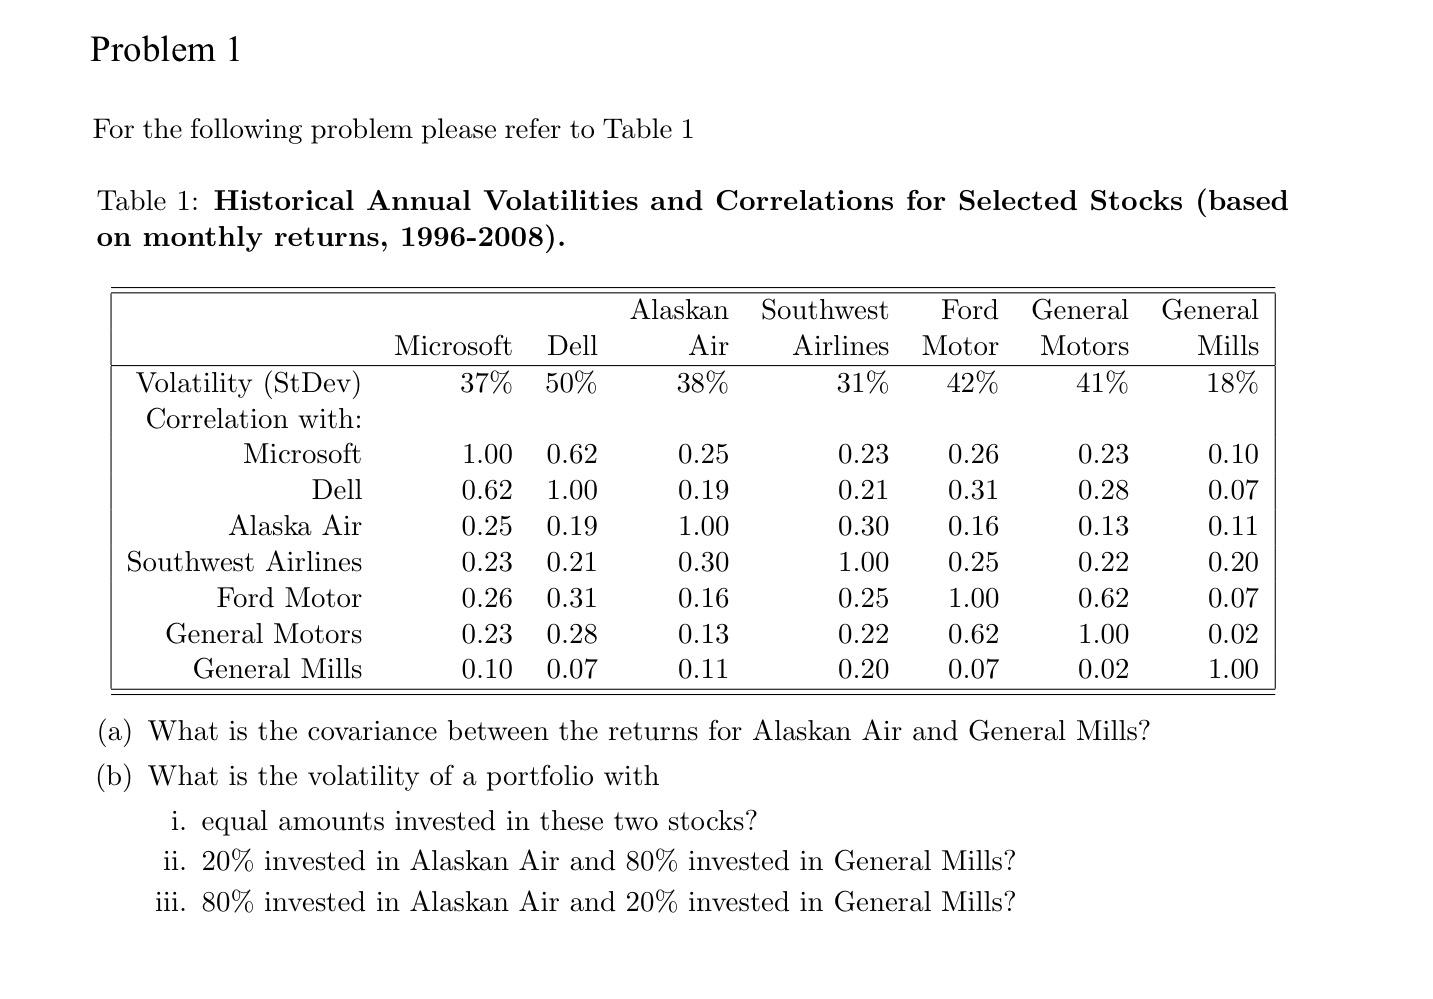
Problem 1 For the following problem please refer to Table 1 Table 1: Historical Annual Volatilities and Correlations for Selected Stocks (based on monthly returns, 1996-2008). Microsoft 37% Dell 50% Alaskan Southwest Ford Air Airlines Motor 38% 31% 42% General Motors 41% General Mills 18% Volatility (St Dev) Correlation with: Microsoft Dell Alaska Air Southwest Airlines Ford Motor General Motors General Mills 1.00 0.62 0.25 0.23 0.26 0.23 0.10 0.62 1.00 0.19 0.21 0.31 0.28 0.07 0.25 0.19 1.00 0.30 0.16 0.13 0.11 0.23 0.21 0.30 1.00 0.25 0.22 0.20 0.26 0.31 0.16 0.25 1.00 0.62 0.07 0.23 0.28 0.13 0.22 0.62 1.00 0.02 0.10 0.07 0.11 0.20 0.07 0.02 1.00 (a) What is the covariance between the returns for Alaskan Air and General Mills? (b) What is the volatility of a portfolio with i. equal amounts invested in these two stocks? ii. 20% invested in Alaskan Air and 80% invested in General Mills? iii. 80% invested in Alaskan Air and 20% invested in General Mills
Step by Step Solution
There are 3 Steps involved in it

Get step-by-step solutions from verified subject matter experts