

Question: Problem 1: Forecasting Period Demand Demand 2018 2016 September October November 5,038 6,157 6,996 December 8,425 2017 January February 8,700 8,018 7,646 6,808 7,558 March
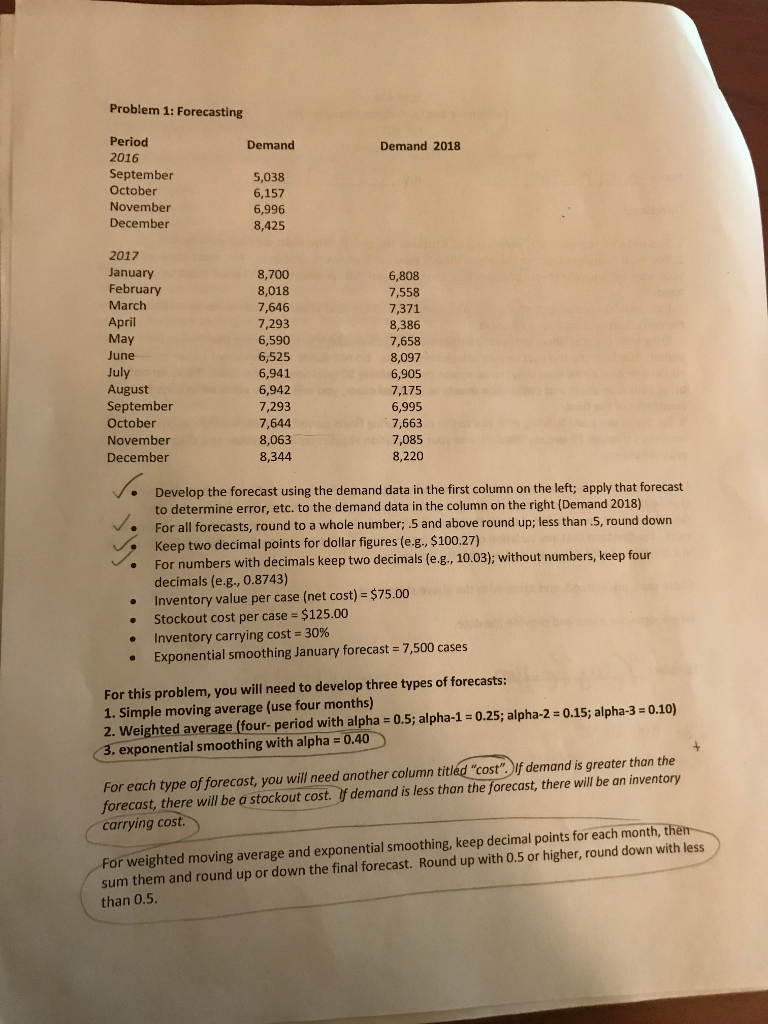
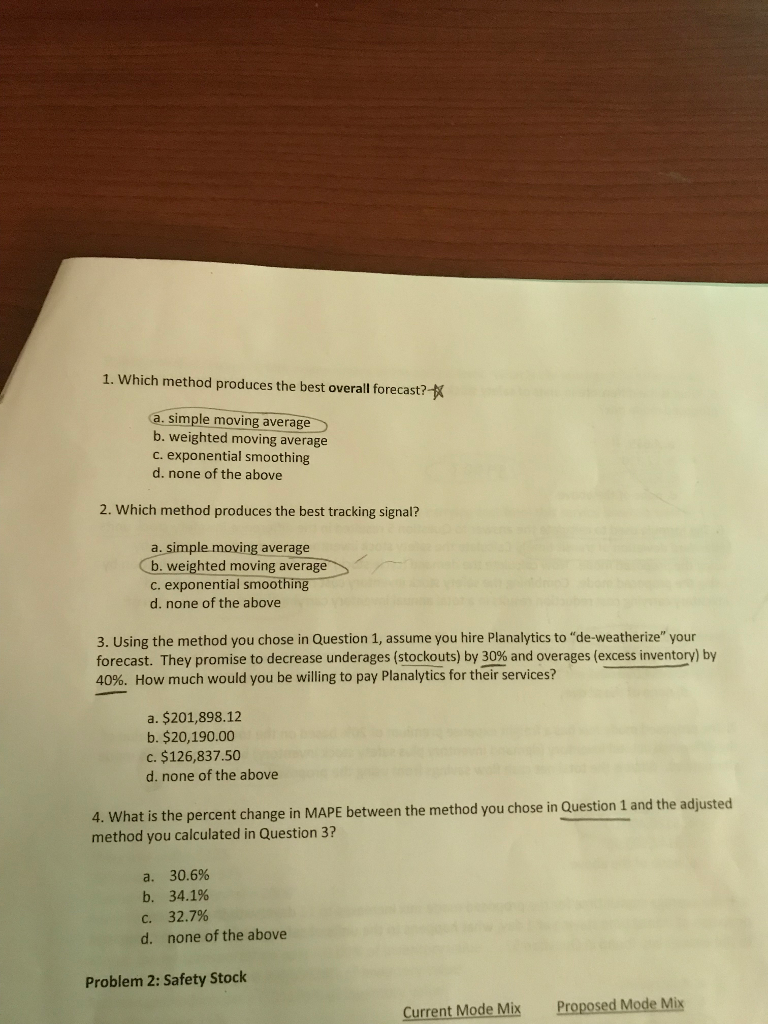
Problem 1: Forecasting Period Demand Demand 2018 2016 September October November 5,038 6,157 6,996 December 8,425 2017 January February 8,700 8,018 7,646 6,808 7,558 March 7,371 8,386 7,658 April 7,293 6,590 May June 8,097 6,905 6,525 July August September 6,941 6,942 7,293 7,644 7,175 6,995 7,663 October 8,063 7,085 November 8,220 December 8,344 Develop the forecast using the demand data in the first column on the left; apply that forecast to determine error, etc. to the demand data in the column on the right (Demand 2018) For all forecasts, round to a whole number; .5 and above round up; less than .5, round down Keep two decimal points for dollar figures (e.g., $100.27) For numbers with decimals keep two decimals (e.g., 10.03); without numbers, keep four decimals (e.g., 0.8743) Inventory value per case (net cost) = $75.00 Stockout cost per case = $125.00 %3D Inventory carrying cost = 30% Exponential smoothing January forecast = 7,500 cases %3D For this problem, you will need to develop three types of forecasts: 1. Simple moving average (use four months) 2. Weighted average (four- period with alpha = 0.5; alpha-1 = 0.25; alpha-2 = 0.15; alpha-3 = 0.10) 3. exponential smoothing with alpha = 0.40 %3D For each type of forecast, you will need another column titld "cost". If demand is greater than the forecast, there will be a stockout cost. If demand is less than the forecast, there will be an inventory carrying cost. For weighted moving average and exponential smoothing, keep decimal points for each month, them sum them and round up or down the final forecast. Round up with 0.5 or higher, round down with less than 0.5. 1. Which method produces the best overall forecast? a. simple moving average b. weighted moving average c. exponential smoothing d. none of the above 2. Which method produces the best tracking signal? a. simple moving average b. weighted moving average c. exponential smoothing d. none of the above 3. Using the method you chose in Question 1, assume you hire Planalytics to "de-weatherize" your forecast. They promise to decrease underages (stockouts) by 30% and overages (excess inventory) by 40%. How much would you be willing to pay Planalytics for their services? a. $201,898.12 b. $20,190.00 c. $126,837.50 d. none of the above 4. What is the percent change in MAPE between the method you chose in Question 1 and the adjusted method you calculated in Question 3? a. 30.6% b. 34.1% C. 32.7% none of the above d. Problem 2: Safety Stock Proposed Mode Mix Current Mode Mix Problem 1: Forecasting Period Demand Demand 2018 2016 September October November 5,038 6,157 6,996 December 8,425 2017 January February 8,700 8,018 7,646 6,808 7,558 March 7,371 8,386 7,658 April 7,293 6,590 May June 8,097 6,905 6,525 July August September 6,941 6,942 7,293 7,644 7,175 6,995 7,663 October 8,063 7,085 November 8,220 December 8,344 Develop the forecast using the demand data in the first column on the left; apply that forecast to determine error, etc. to the demand data in the column on the right (Demand 2018) For all forecasts, round to a whole number; .5 and above round up; less than .5, round down Keep two decimal points for dollar figures (e.g., $100.27) For numbers with decimals keep two decimals (e.g., 10.03); without numbers, keep four decimals (e.g., 0.8743) Inventory value per case (net cost) = $75.00 Stockout cost per case = $125.00 %3D Inventory carrying cost = 30% Exponential smoothing January forecast = 7,500 cases %3D For this problem, you will need to develop three types of forecasts: 1. Simple moving average (use four months) 2. Weighted average (four- period with alpha = 0.5; alpha-1 = 0.25; alpha-2 = 0.15; alpha-3 = 0.10) 3. exponential smoothing with alpha = 0.40 %3D For each type of forecast, you will need another column titld "cost". If demand is greater than the forecast, there will be a stockout cost. If demand is less than the forecast, there will be an inventory carrying cost. For weighted moving average and exponential smoothing, keep decimal points for each month, them sum them and round up or down the final forecast. Round up with 0.5 or higher, round down with less than 0.5. 1. Which method produces the best overall forecast? a. simple moving average b. weighted moving average c. exponential smoothing d. none of the above 2. Which method produces the best tracking signal? a. simple moving average b. weighted moving average c. exponential smoothing d. none of the above 3. Using the method you chose in Question 1, assume you hire Planalytics to "de-weatherize" your forecast. They promise to decrease underages (stockouts) by 30% and overages (excess inventory) by 40%. How much would you be willing to pay Planalytics for their services? a. $201,898.12 b. $20,190.00 c. $126,837.50 d. none of the above 4. What is the percent change in MAPE between the method you chose in Question 1 and the adjusted method you calculated in Question 3? a. 30.6% b. 34.1% C. 32.7% none of the above d. Problem 2: Safety Stock Proposed Mode Mix Current Mode Mix
Step by Step Solution
There are 3 Steps involved in it

Get step-by-step solutions from verified subject matter experts