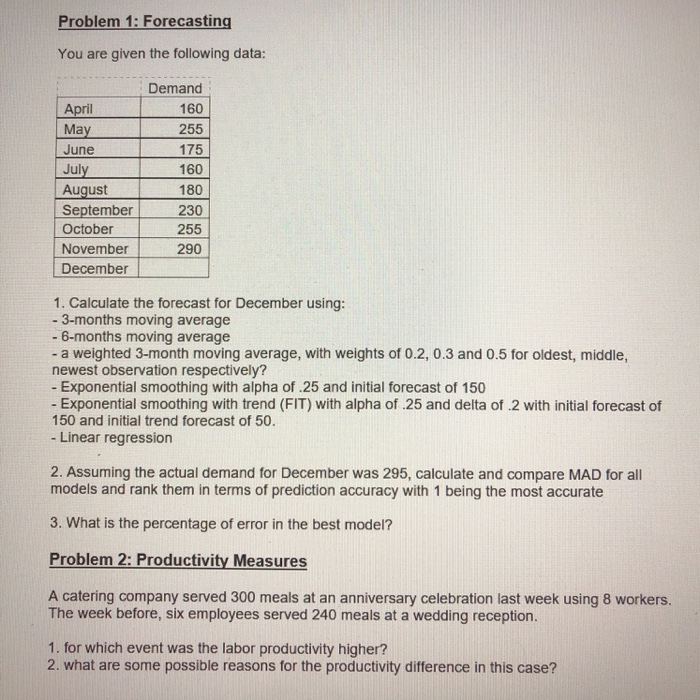
Question: Problem 1: Forecasting You are given the following data: Demand April 160 May 255 June 175 July 160 August 180 September 230 October 255 November

Problem 1: Forecasting You are given the
Problem 1: Forecasting You are given the following data: Demand April 160 May 255 June 175 July 160 August 180 September 230 October 255 November 290 December 1. Calculate the forecast for December using: - 3-months moving average - 6-months moving average - a weighted 3-month moving average, with weights of 0.2, 0.3 and 0.5 for oldest, middle, newest observation respectively? - Exponential smoothing with alpha of 25 and initial forecast of 150 - Exponential smoothing with trend (FIT) with alpha of .25 and delta of 2 with initial forecast of 150 and initial trend forecast of 50. - Linear regression 2. Assuming the actual demand for December was 295, calculate and compare MAD for all models and rank them in terms of prediction accuracy with 1 being the most accurate 3. What is the percentage of error in the best model? Problem 2: Productivity Measures A catering company served 300 meals at an anniversary celebration last week using 8 workers. The week before, six employees served 240 meals at a wedding reception. 1. for which event was the labor productivity higher? 2. what are some possible reasons for the productivity difference in this case

Step by Step Solution

There are 3 Steps involved in it

1 Expert Approved Answer
Step: 1 Unlock blur-text-image
Question Has Been Solved by an Expert!

Get step-by-step solutions from verified subject matter experts

Step: 2 Unlock
Step: 3 Unlock

Students Have Also Explored These Related General Management Questions!