

Question: Problem 1 Graphs 195 Toluene/o-Xylene Txy graph at P = 2280 mm Hg 190 -Dew Point -Bubble Point 185 180 175 T (C) 170 165
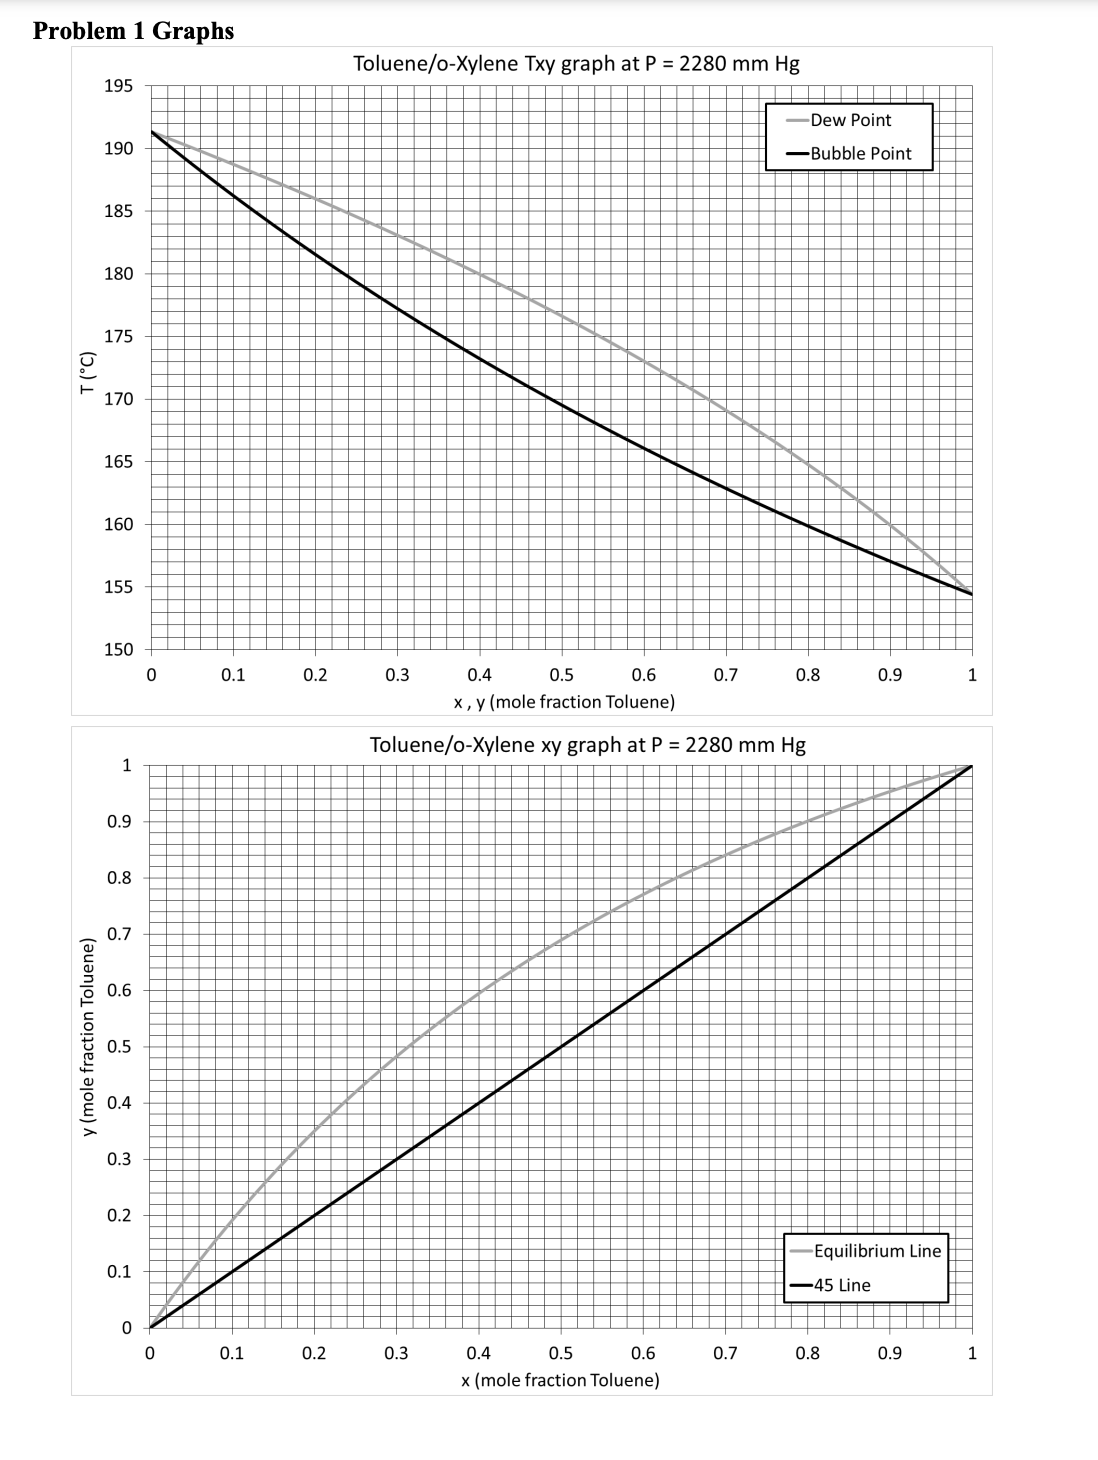 Problem 1 Graphs 195 Toluene/o-Xylene Txy graph at P = 2280 mm Hg 190 -Dew Point -Bubble Point 185 180 175 T (C) 170 165 160 155 150 0 0.1 0.2 0.3 0.4 0.5 0.6 0.7 0.8 0.9 1 x , y (mole fraction Toluene) Toluene/o-Xylene xy graph at P = 2280 mm Hg 0.9 0.8 0.7 0.6 y (mole fraction Toluene) 0.5 0.4 0.3 0.2 0.1 Equilibrium Line -45 Line 0 0 0.1 0.2 0.3 0.4 0.5 0.6 0.7 0.8 0.9 x (mole fraction Toluene)
Step by Step Solution
There are 3 Steps involved in it
1 Expert Approved Answer
Step: 1 Unlock

Question Has Been Solved by an Expert!
Get step-by-step solutions from verified subject matter experts
Step: 2 Unlock
Step: 3 Unlock