

Question: Problem 1: In chapter 3, Monetary Approach, we have derived the theory of Purchasing Power Parity (PPP) that links exchange rates to the relative prices
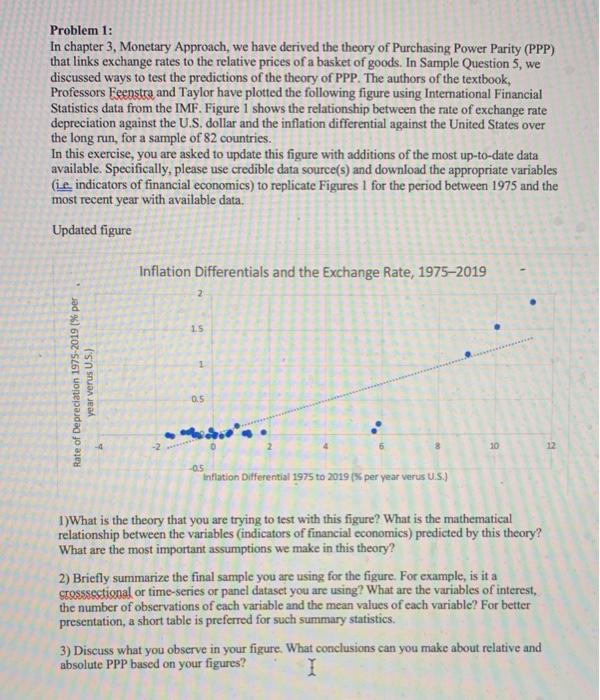
Problem 1: In chapter 3, Monetary Approach, we have derived the theory of Purchasing Power Parity (PPP) that links exchange rates to the relative prices of a basket of goods. In Sample Question 5, we discussed ways to test the predictions of the theory of PPP. The authors of the textbook, Professors Feenstra and Taylor have plotted the following figure using International Financial Statistics data from the IMF. Figure 1 shows the relationship between the rate of exchange rate depreciation against the U.S. dollar and the inflation differential against the United States over the long run, for a sample of 82 countries. In this exercise, you are asked to update this figure with additions of the most up-to-date data available. Specifically, please use credible data source(s) and download the appropriate variables (ie indicators of financial economics) to replicate Figures 1 for the period between 1975 and the most recent year with available data. Updated figure Inflation Differentials and the Exchange Rate, 19752019 2 15 1 Rate of Depreciation 1975-2019 % per year verus U.S.) 0.5 -4 10 2 -05 Inflation Differential 1975 to 2019 (% per year verus U.S.) 1)What is the theory that you are trying to test with this figure? What is the mathematical relationship between the variables (indicators of financial economics) predicted by this theory? What are the most important assumptions we make in this theory? 2) Briefly summarize the final sample you are using for the figure. For example, is it a Stossssstional or time-series or panel dataset you are using? What are the variables of interest the number of observations of each variable and the mean values of each variable? For better presentation, a short table is preferred for such summary statistics. 3) Discuss what you observe in your figure. What conclusions can you make about relative and absolute PPP based on your figures? I Problem 1: In chapter 3, Monetary Approach, we have derived the theory of Purchasing Power Parity (PPP) that links exchange rates to the relative prices of a basket of goods. In Sample Question 5, we discussed ways to test the predictions of the theory of PPP. The authors of the textbook, Professors Feenstra and Taylor have plotted the following figure using International Financial Statistics data from the IMF. Figure 1 shows the relationship between the rate of exchange rate depreciation against the U.S. dollar and the inflation differential against the United States over the long run, for a sample of 82 countries. In this exercise, you are asked to update this figure with additions of the most up-to-date data available. Specifically, please use credible data source(s) and download the appropriate variables (ie indicators of financial economics) to replicate Figures 1 for the period between 1975 and the most recent year with available data. Updated figure Inflation Differentials and the Exchange Rate, 19752019 2 15 1 Rate of Depreciation 1975-2019 % per year verus U.S.) 0.5 -4 10 2 -05 Inflation Differential 1975 to 2019 (% per year verus U.S.) 1)What is the theory that you are trying to test with this figure? What is the mathematical relationship between the variables (indicators of financial economics) predicted by this theory? What are the most important assumptions we make in this theory? 2) Briefly summarize the final sample you are using for the figure. For example, is it a Stossssstional or time-series or panel dataset you are using? What are the variables of interest the number of observations of each variable and the mean values of each variable? For better presentation, a short table is preferred for such summary statistics. 3) Discuss what you observe in your figure. What conclusions can you make about relative and absolute PPP based on your figures
Step by Step Solution
There are 3 Steps involved in it

Get step-by-step solutions from verified subject matter experts