

Question: Problem 1: In the below table you can see activities, duration and predecessors. Also the number of people needed to work in each task is
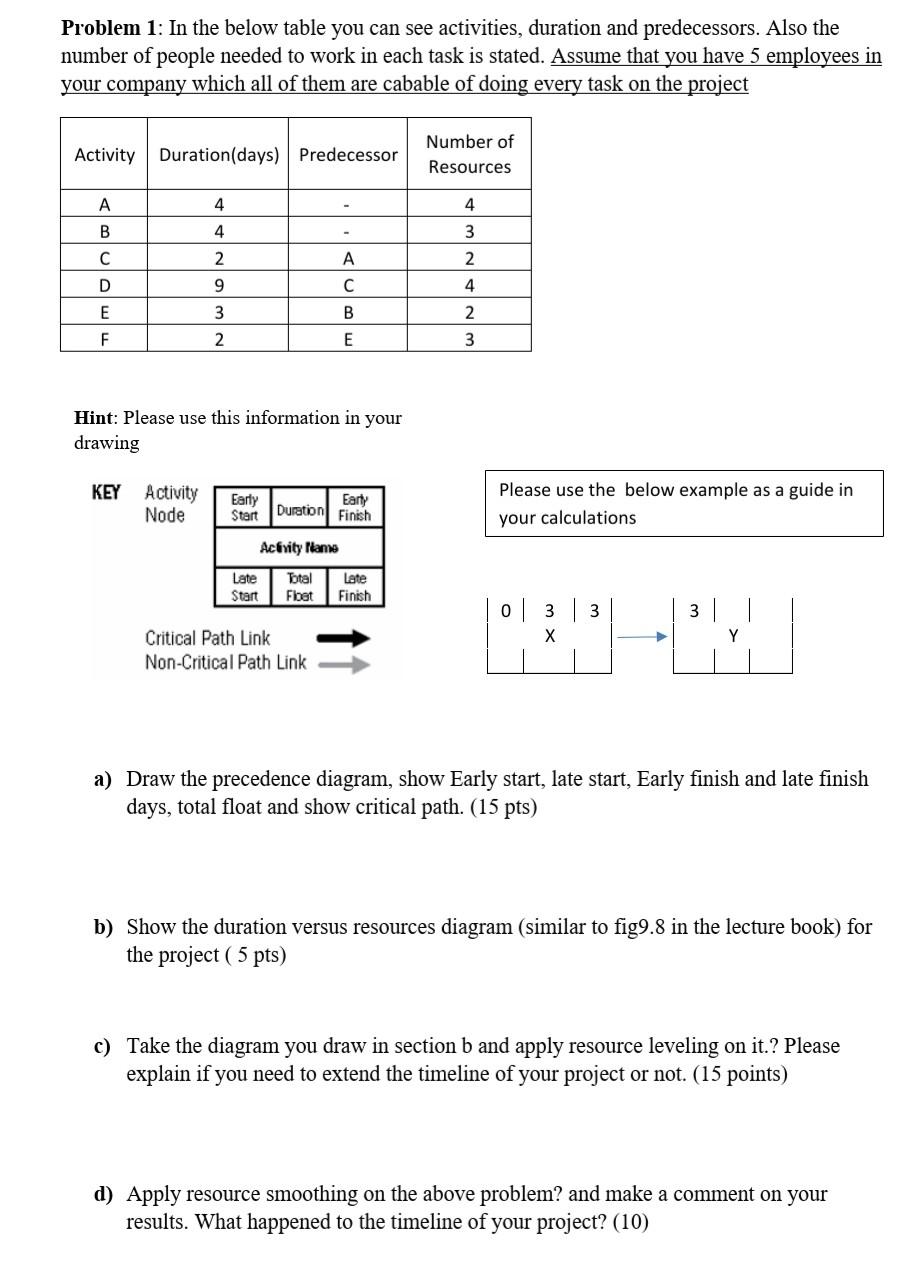
Problem 1: In the below table you can see activities, duration and predecessors. Also the number of people needed to work in each task is stated. Assume that you have 5 employees in your company which all of them are cabable of doing every task on the project Activity Duration(days) Predecessor Number of Resources 4 4 A B 4 3 2 A 2 9 C 4 D E F 3 B 2 2 E 3 Hint: Please use this information in your drawing KEY Activity Node Early Start Early Duration Finish Please use the below example as a guide in your calculations Activity lame Late Total Late Start Fbet Finish 0 | 3 | 3 3 | Critical Path Link Non-Critical Path Link a) Draw the precedence diagram, show Early start, late start, Early finish and late finish days, total float and show critical path. (15 pts) b) Show the duration versus resources diagram (similar to fig9.8 in the lecture book) for the project ( 5 pts) c) Take the diagram you draw in section b and apply resource leveling on it.? Please explain if you need to extend the timeline of your project or not. (15 points) d) Apply resource smoothing on the above problem? and make a comment on your results. What happened to the timeline of your project? (10) Problem 1: In the below table you can see activities, duration and predecessors. Also the number of people needed to work in each task is stated. Assume that you have 5 employees in your company which all of them are cabable of doing every task on the project Activity Duration(days) Predecessor Number of Resources 4 4 A B 4 3 2 A 2 9 C 4 D E F 3 B 2 2 E 3 Hint: Please use this information in your drawing KEY Activity Node Early Start Early Duration Finish Please use the below example as a guide in your calculations Activity lame Late Total Late Start Fbet Finish 0 | 3 | 3 3 | Critical Path Link Non-Critical Path Link a) Draw the precedence diagram, show Early start, late start, Early finish and late finish days, total float and show critical path. (15 pts) b) Show the duration versus resources diagram (similar to fig9.8 in the lecture book) for the project ( 5 pts) c) Take the diagram you draw in section b and apply resource leveling on it.? Please explain if you need to extend the timeline of your project or not. (15 points) d) Apply resource smoothing on the above problem? and make a comment on your results. What happened to the timeline of your project
Step by Step Solution
There are 3 Steps involved in it
1 Expert Approved Answer
Step: 1 Unlock

Question Has Been Solved by an Expert!
Get step-by-step solutions from verified subject matter experts
Step: 2 Unlock
Step: 3 Unlock