

Question: Problem 1 Intro The following table shows historical end-of-week adjusted close prices (including dividends) for a stock and the S&P 500. 1 2 A Week
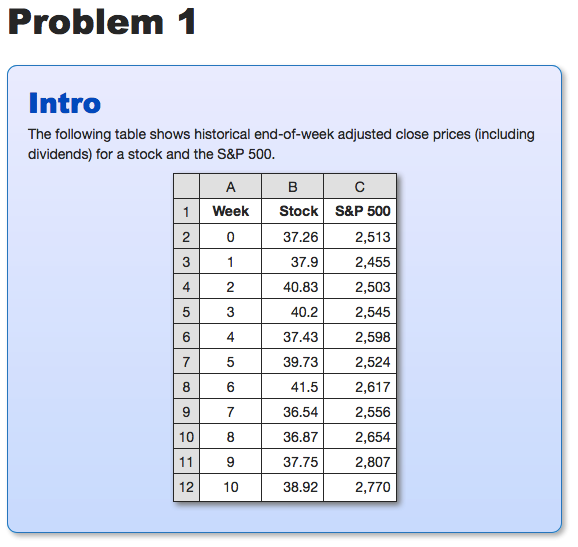
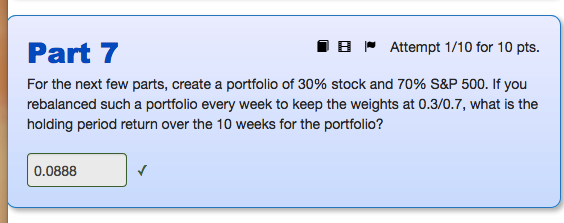
Problem 1 Intro The following table shows historical end-of-week adjusted close prices (including dividends) for a stock and the S&P 500. 1 2 A Week 0 1 B Stock 37.26 37.9 40.83 40.2 37.43 39.73 41.5 36.54 36.87 37.75 38.92 C S&P 500 2,513 2,455 2,503 2,545 2,598 2,524 2,617 2,556 2,654 2,807 2,770 8 9 10 11 6 7 8 9 Part 7 IB Attempt 1/10 for 10 pts. For the next few parts, create a portfolio of 30% stock and 70% S&P 500. If you rebalanced such a portfolio every week to keep the weights at 0.3/0.7, what is the holding period return over the 10 weeks for the portfolio? 0.0888 Problem 1 Intro The following table shows historical end-of-week adjusted close prices (including dividends) for a stock and the S&P 500. 1 2 A Week 0 1 B Stock 37.26 37.9 40.83 40.2 37.43 39.73 41.5 36.54 36.87 37.75 38.92 C S&P 500 2,513 2,455 2,503 2,545 2,598 2,524 2,617 2,556 2,654 2,807 2,770 8 9 10 11 6 7 8 9 Part 7 IB Attempt 1/10 for 10 pts. For the next few parts, create a portfolio of 30% stock and 70% S&P 500. If you rebalanced such a portfolio every week to keep the weights at 0.3/0.7, what is the holding period return over the 10 weeks for the portfolio? 0.0888
Step by Step Solution
There are 3 Steps involved in it

Get step-by-step solutions from verified subject matter experts