

Question: problem 1: it is better to provide analytical graphs, using statistical tools such as Minitab. In an experiment to study the compressive strength of concrete.
problem 1:
it is better to provide analytical graphs, using statistical tools such as Minitab.
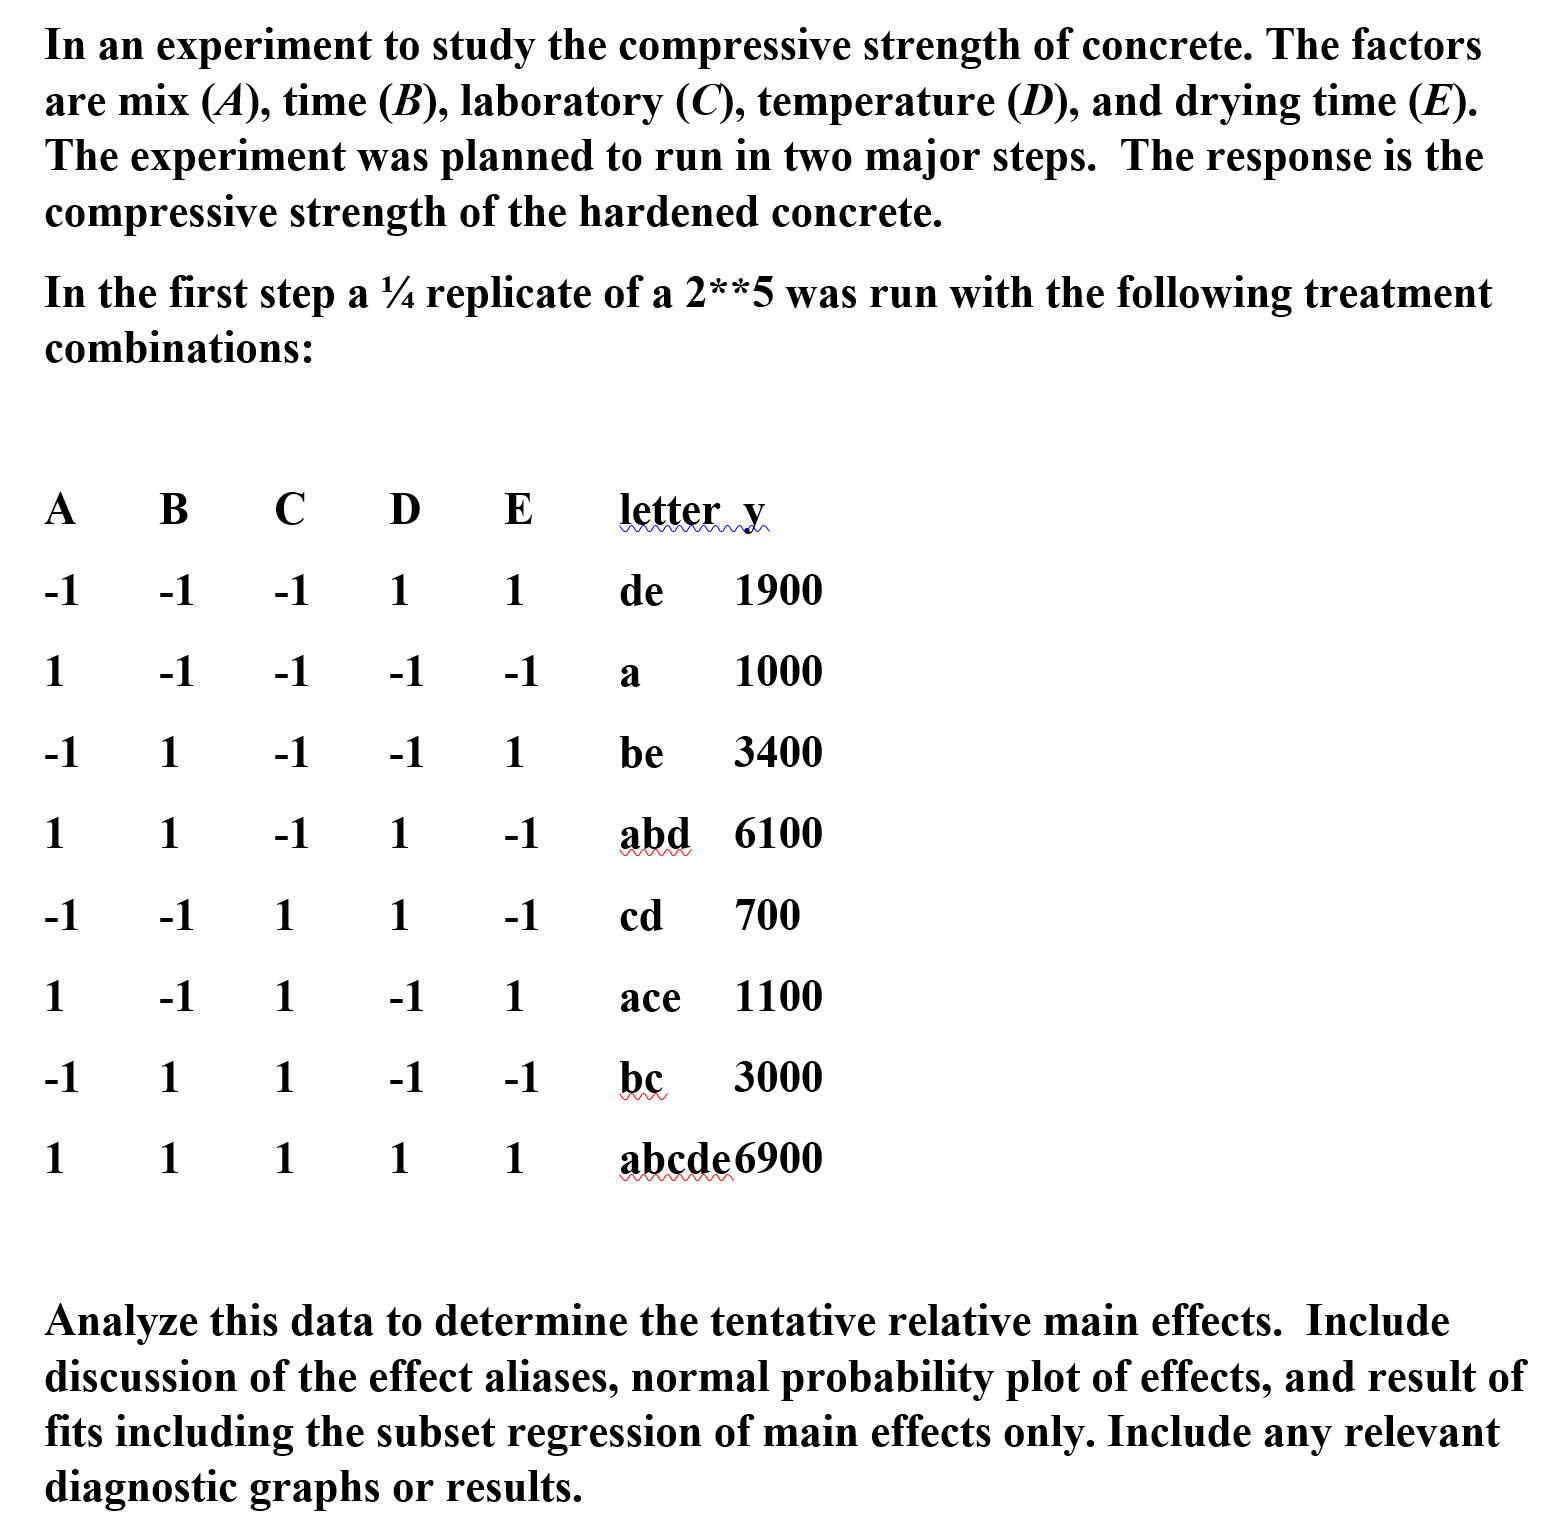
In an experiment to study the compressive strength of concrete. The factors are mix (A), time (B), laboratory (C), temperature (D), and drying time (E). The experiment was planned to run in two major steps. The response is the compressive strength of the hardened concrete. In the rst step a 1%: replicate of a 2**5 was run with the following treatment combinations: ABCDEW 1 1 1 1 1 de 1900 1 -1 -1 -1 -1 a 1000 -1 1 -1 -1 1 be 3400 1 1 1 1 1 am 6100 -1 -1 1 1 -1 cd 700 1 -1 1 -1 1 ace 1100 -1 1 1 -1 -1 be 3000 1 1 1 1 1 W6900 Analyze this data to determine the tentative relative main effects. Include discussion of the effect aliases, normal probability plot of effects, and result of ts including the subset regression of main effects only. Include any relevant diagnostic graphs or results
Step by Step Solution
There are 3 Steps involved in it

Get step-by-step solutions from verified subject matter experts